Atmospheric Methane Tagged by Source for Science on a Sphere
Science On A Sphere Content
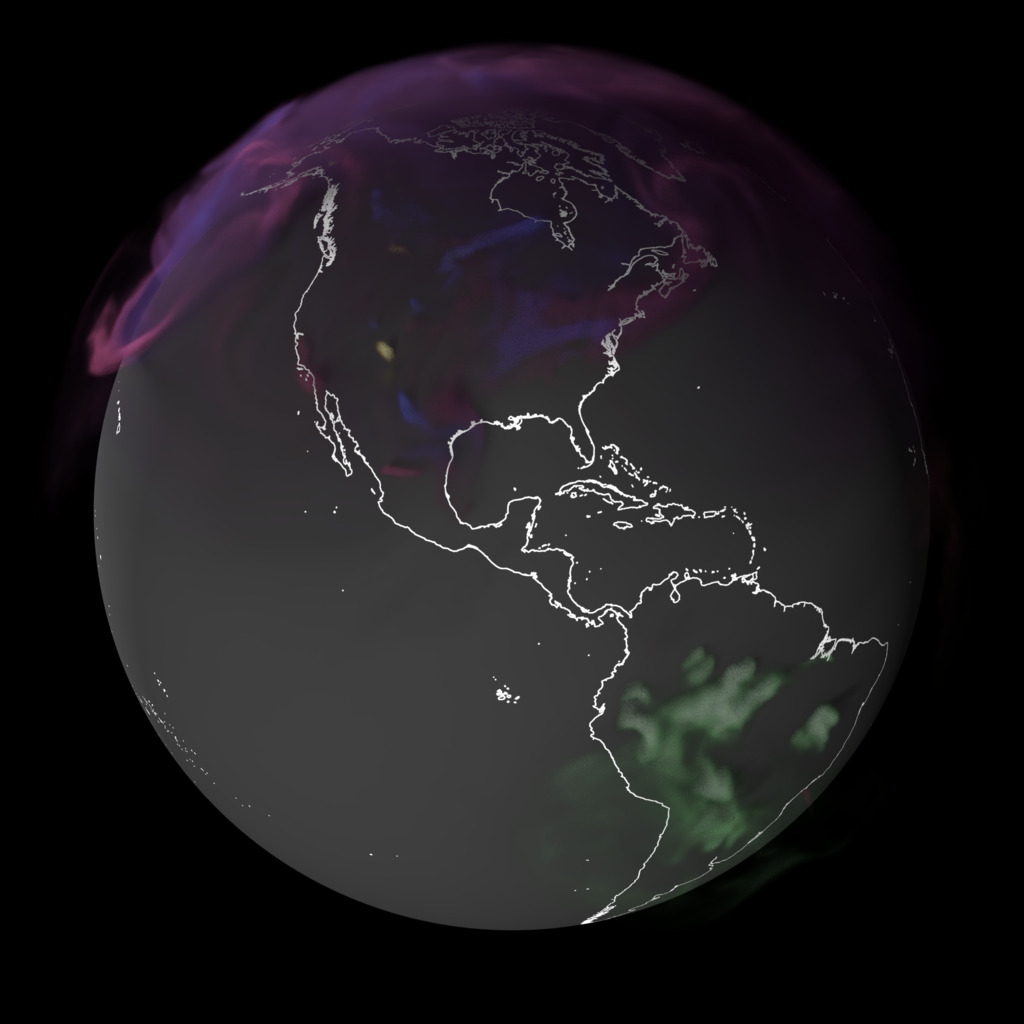
This data visualization shows methane in Earth's atmosphere during 2021. The colors represent different sources: agriculture and waste (fuchsia), industry (blue), wetlands (green), burning forests and farmlands (yellow) and other natural (gray). Advanced computer modeling techniques at NASA's Global Modeling and Assimilation Office allow us to view the distribution of CH4 sources to better understand how methane moves through Earth’s systems.
Equirectangular Content
This view shows all of the 5 methane sources in different colors. Individual sources can be seen in isolation below.
Individual Tagged Sources

Colorbar for the Science-On-A-Sphere legend system.
Credits
Please give credit for this item to:
NASA's Scientific Visualization Studio
-
Data visualizers
-
AJ Christensen
(SSAI)

-
Mark SubbaRao
(NASA/GSFC)
-
Helen-Nicole Kostis
(USRA)
-
Greg Shirah
(NASA/GSFC)
-
AJ Christensen
(SSAI)
-
Technical support
- Laurence Schuler (ADNET Systems, Inc.)
- Ian Jones (ADNET Systems, Inc.)
-
Scientists
-
Lesley Ott
(NASA/GSFC)
-
Sourish Basu
(University of Maryland, College Park)
-
Lesley Ott
(NASA/GSFC)
Datasets used
-
GMAO GEOS Atmospheric Methane (GMAO GEOS Atmospheric Methane)
ID: 1066
Note: While we identify the data sets used on this page, we do not store any further details, nor the data sets themselves on our site.
Citing this page
Alternate Versions
- ID: 5424
 Visualization
Release date
This page was originally published on Friday, July 11, 2025.
This page was last updated on Thursday, July 10, 2025 at 4:43 PM EDT.