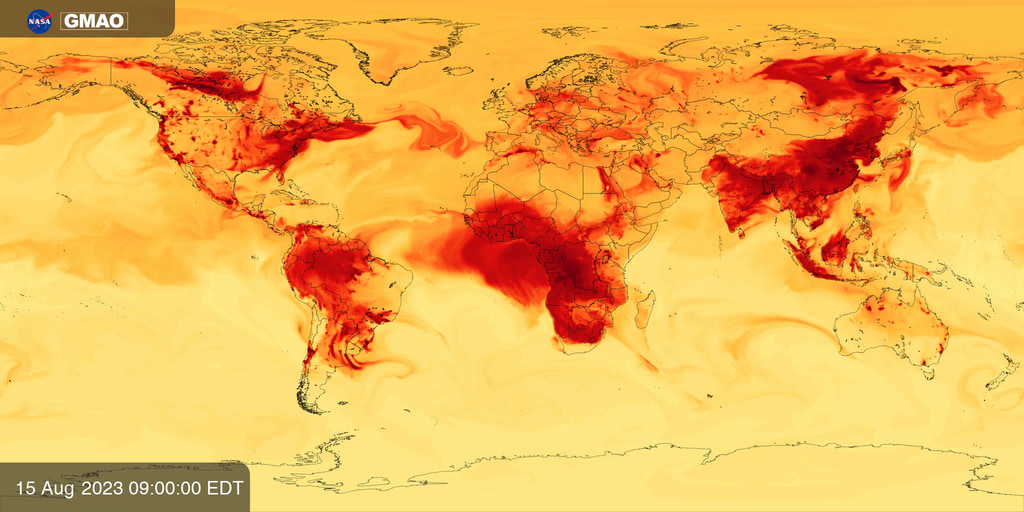
Nitrogen Oxides (NOx)
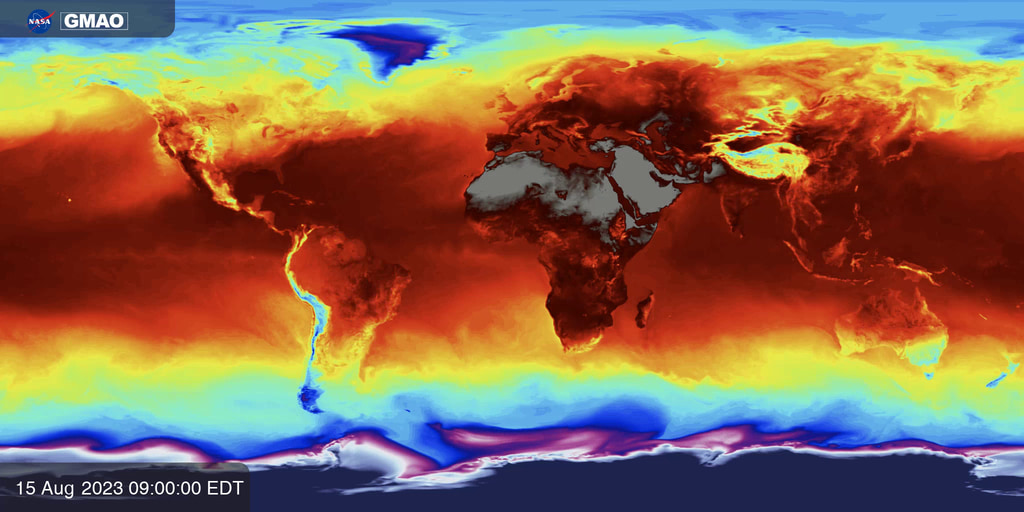
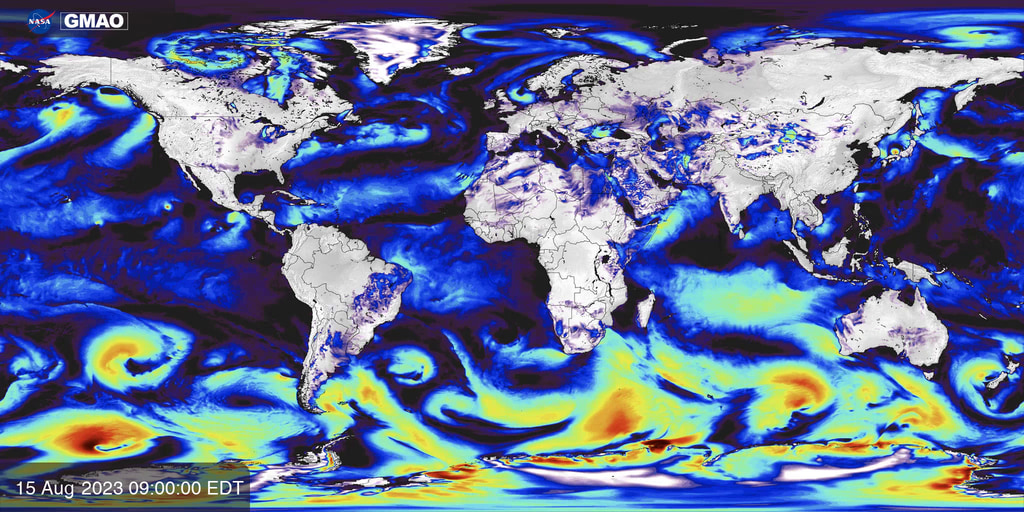
Near surface concentration of Nitrogen Oxides (NOx) estimated from concentrations of nitrogen oxide and nitrogen dioxide produced by sNASA’s GEOS-CF model.
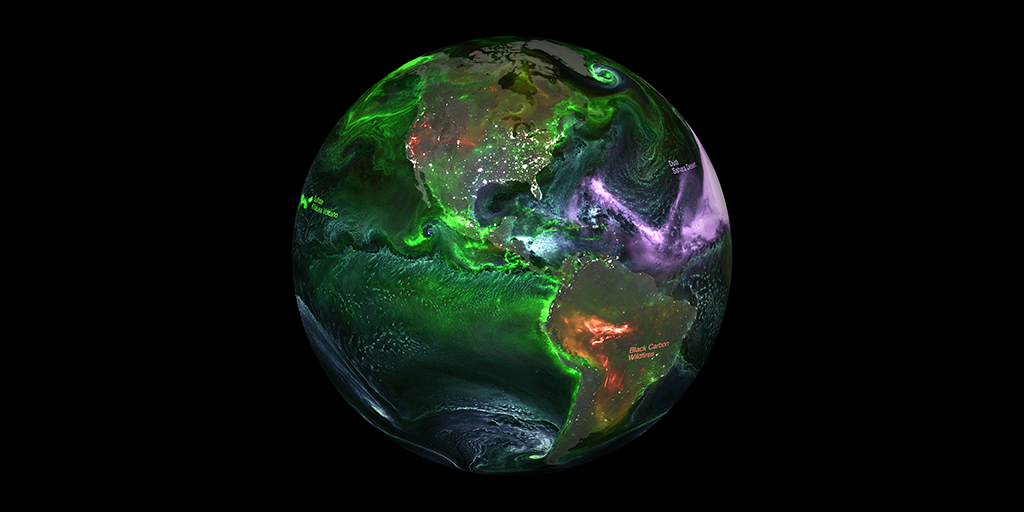
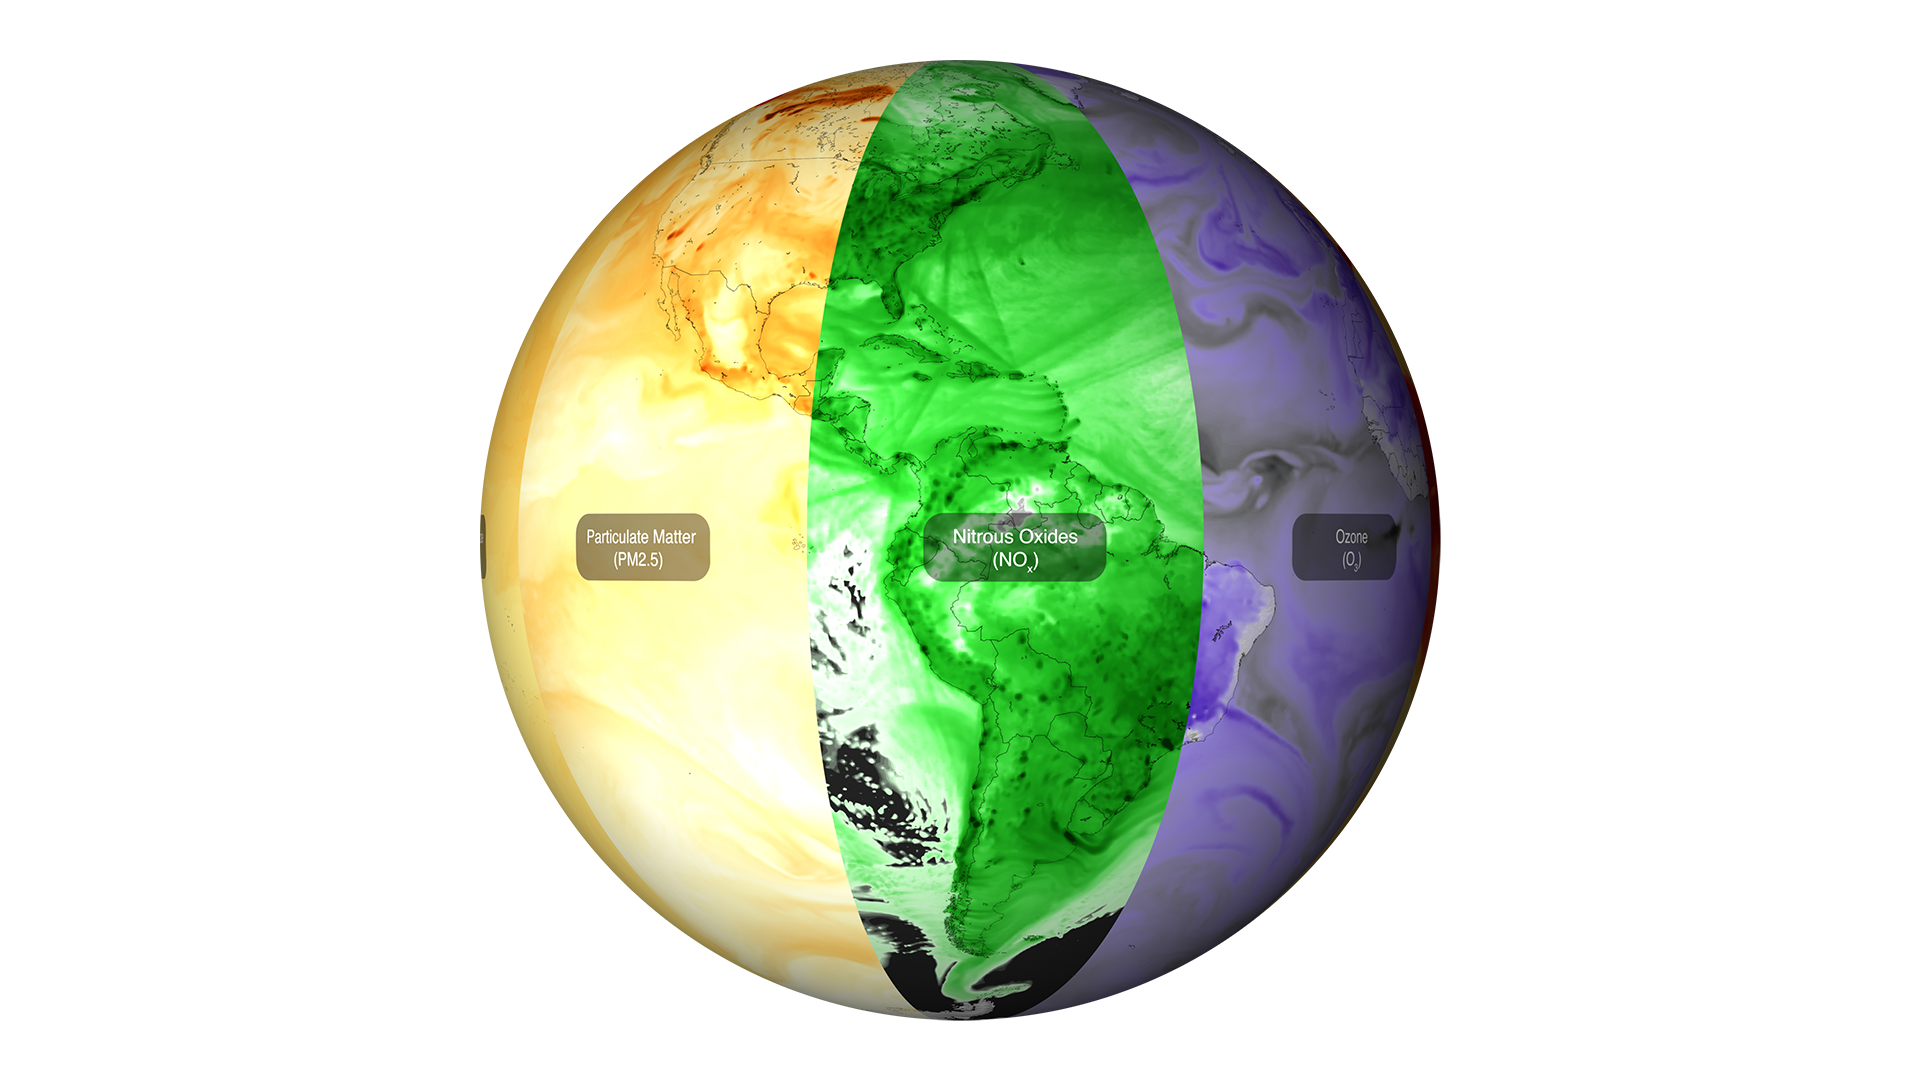
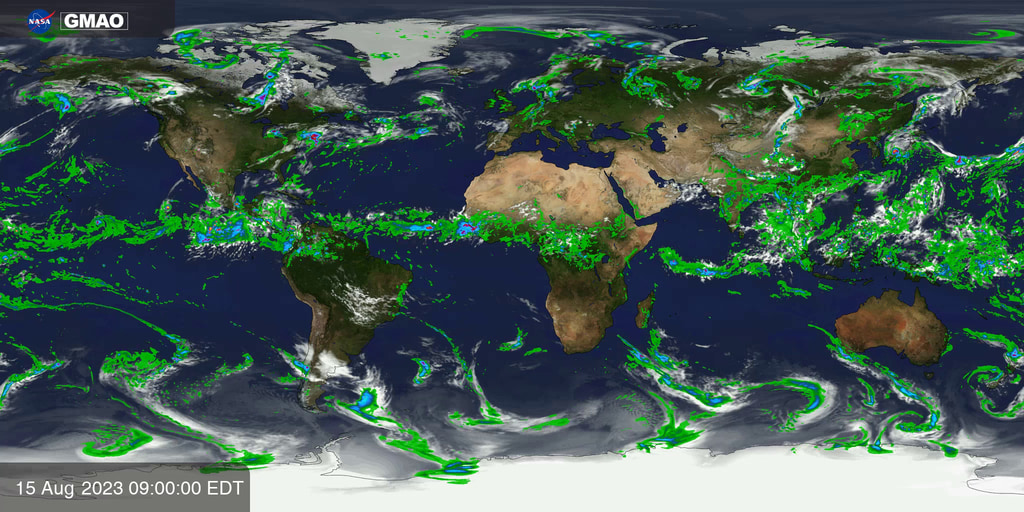
Predictions of air pollution are created using complex models that combine information about weather and the emissions, transformation, and transport of chemical species and particles. The Goddard Earth Observing System Composition Forecasting (GEOS-CF) system is a research model maintained by NASA’s Global Modeling and Assimilation Office to help scientists understand the causes and impact of air pollution. It is one of the highest resolution and most detailed models of its kind in the world, made possible through ongoing collaborations between NASA and university scientists. GEOS-CF tracks the concentrations of hundreds of gas phase chemical species and dozens of types of particles characterized by their composition and size. It is used by a wide variety of stakeholders around the world to develop new methods for improving local predictions, understanding the impact of pollution on human health, and improving the quality of NASA satellite datasets.
Nitrogen Oxides (NOx) is the collective name for nitrogen oxide (NO) and nitrogen dioxide (NO2). Scientists often group the two together because they have short lifetimes of only a few hours in the atmosphere and react frequently with each other. Nitrogen oxides affect human health in two important ways. Large concentrations of nitrogen oxides can damage the respiratory tract directly and contribute to the risk of asthma and respiratory infections. In addition, nitrogen oxide concentrations are a precursor for ozone production, which causes additional damage. Sources include vehicles, industry, and natural phenomena like lightning. Because of their short lifetime, nitrogen oxides are concentrated near the sources that emitted them and are visible in the animation near urban areas, power plants, and roadways.

Nitrogen Oxides (NOx) concentration colorbar with semi-transparent background, optimized for Earth Information Center content.

Nitrogen Oxides (NOx) concentration colorbar.
For More Information
Credits
Please give credit for this item to:
NASA's Global Modeling and Assimiliation Office
-
Visualizer
- Joseph V. Ardizzone (NASA/GSFC)
Series
This page can be found in the following series:Related papers
Description of the NASA GEOS composition forecast modeling system GEOS-CF v1.0
Keller, C. A., Knowland, K. E., Duncan, B. N., Liu, J., Anderson, D. C., Das, S., Lucchesi, R. A., Lundgren, E. W., Nicely, J. M., Nielsen, E., Ott, L. E., Saunders, E., Strode, S. A., Wales, P. A., Jacob. D. J., and Pawson, S. (2021). Description of the NASA GEOS composition forecast modeling system GEOS-CF v1.0. Journal of Advances in Modeling Earth Systems, 13, e2020MS002413. 10.1029/2020MS002413.
DOI: 10.1029/2020MS002413
This paper can be found at: https://agupubs.onlinelibrary.wiley.com/doi/10.1029/2020MS002413
NASA GEOS Composition Forecast Modeling System GEOS-CF v1.0: Stratospheric composition
Knowland, K. E., C. A. Keller, P. A. Wales, K. Wargan, L. Coy, M. S. Johnson, J. Liu, R. A. Lucchesi, S. D. Eastham, E. Fleming, Q. Liang, T. Leblanc, N. J. Livesey, K. A. Walker, L. E. Ott, and S. Pawson. (2022). NASA GEOS Composition Forecast Modeling System GEOS-CF v1.0: Stratospheric composition. Journal of Advances in Modeling Earth Systems, 14, e2021MS002852. 10.1029/2021MS002852
DOI: 10.1029/2021MS002852
This paper can be found at: https://agupubs.onlinelibrary.wiley.com/doi/10.1029/2021MS002852
Datasets used
-
GEOS-CF
ID: 1197Knowland, K.E., C.A. Keller, and R. Lucchesi, 2022: File Specification for GEOS-CF Products. GMAO Office Note No. 17 (Version 1.3), 54 pp, available from https://gmao.gsfc.nasa.gov/pubs/docs/Knowland1446.pdf
This dataset can be found at: https://portal.nccs.nasa.gov/datashare/gmao/geos-cf/v2/
See all pages that use this dataset
Note: While we identify the data sets used on this page, we do not store any further details, nor the data sets themselves on our site.
Related
- ID: 5572
 Visualization
 - ID: 5552
 Visualization
 - ID: 5533
 Visualization
 - ID: 5147
 Visualization
 - ID: 5148
 Visualization
 - ID: 5149
 Visualization
 - ID: 5150
 Visualization
 - ID: 5151
 Visualization
 - ID: 5152
 Visualization
 - ID: 5153
 Visualization
Used as a Source In
- ID: 14439
 Produced Video
Release date
This page was originally published on Tuesday, September 26, 2023.
This page was last updated on Sunday, March 1, 2026 at 2:03 AM EST.