A newer version of this visualization is available.
Sea Level Through a Porthole
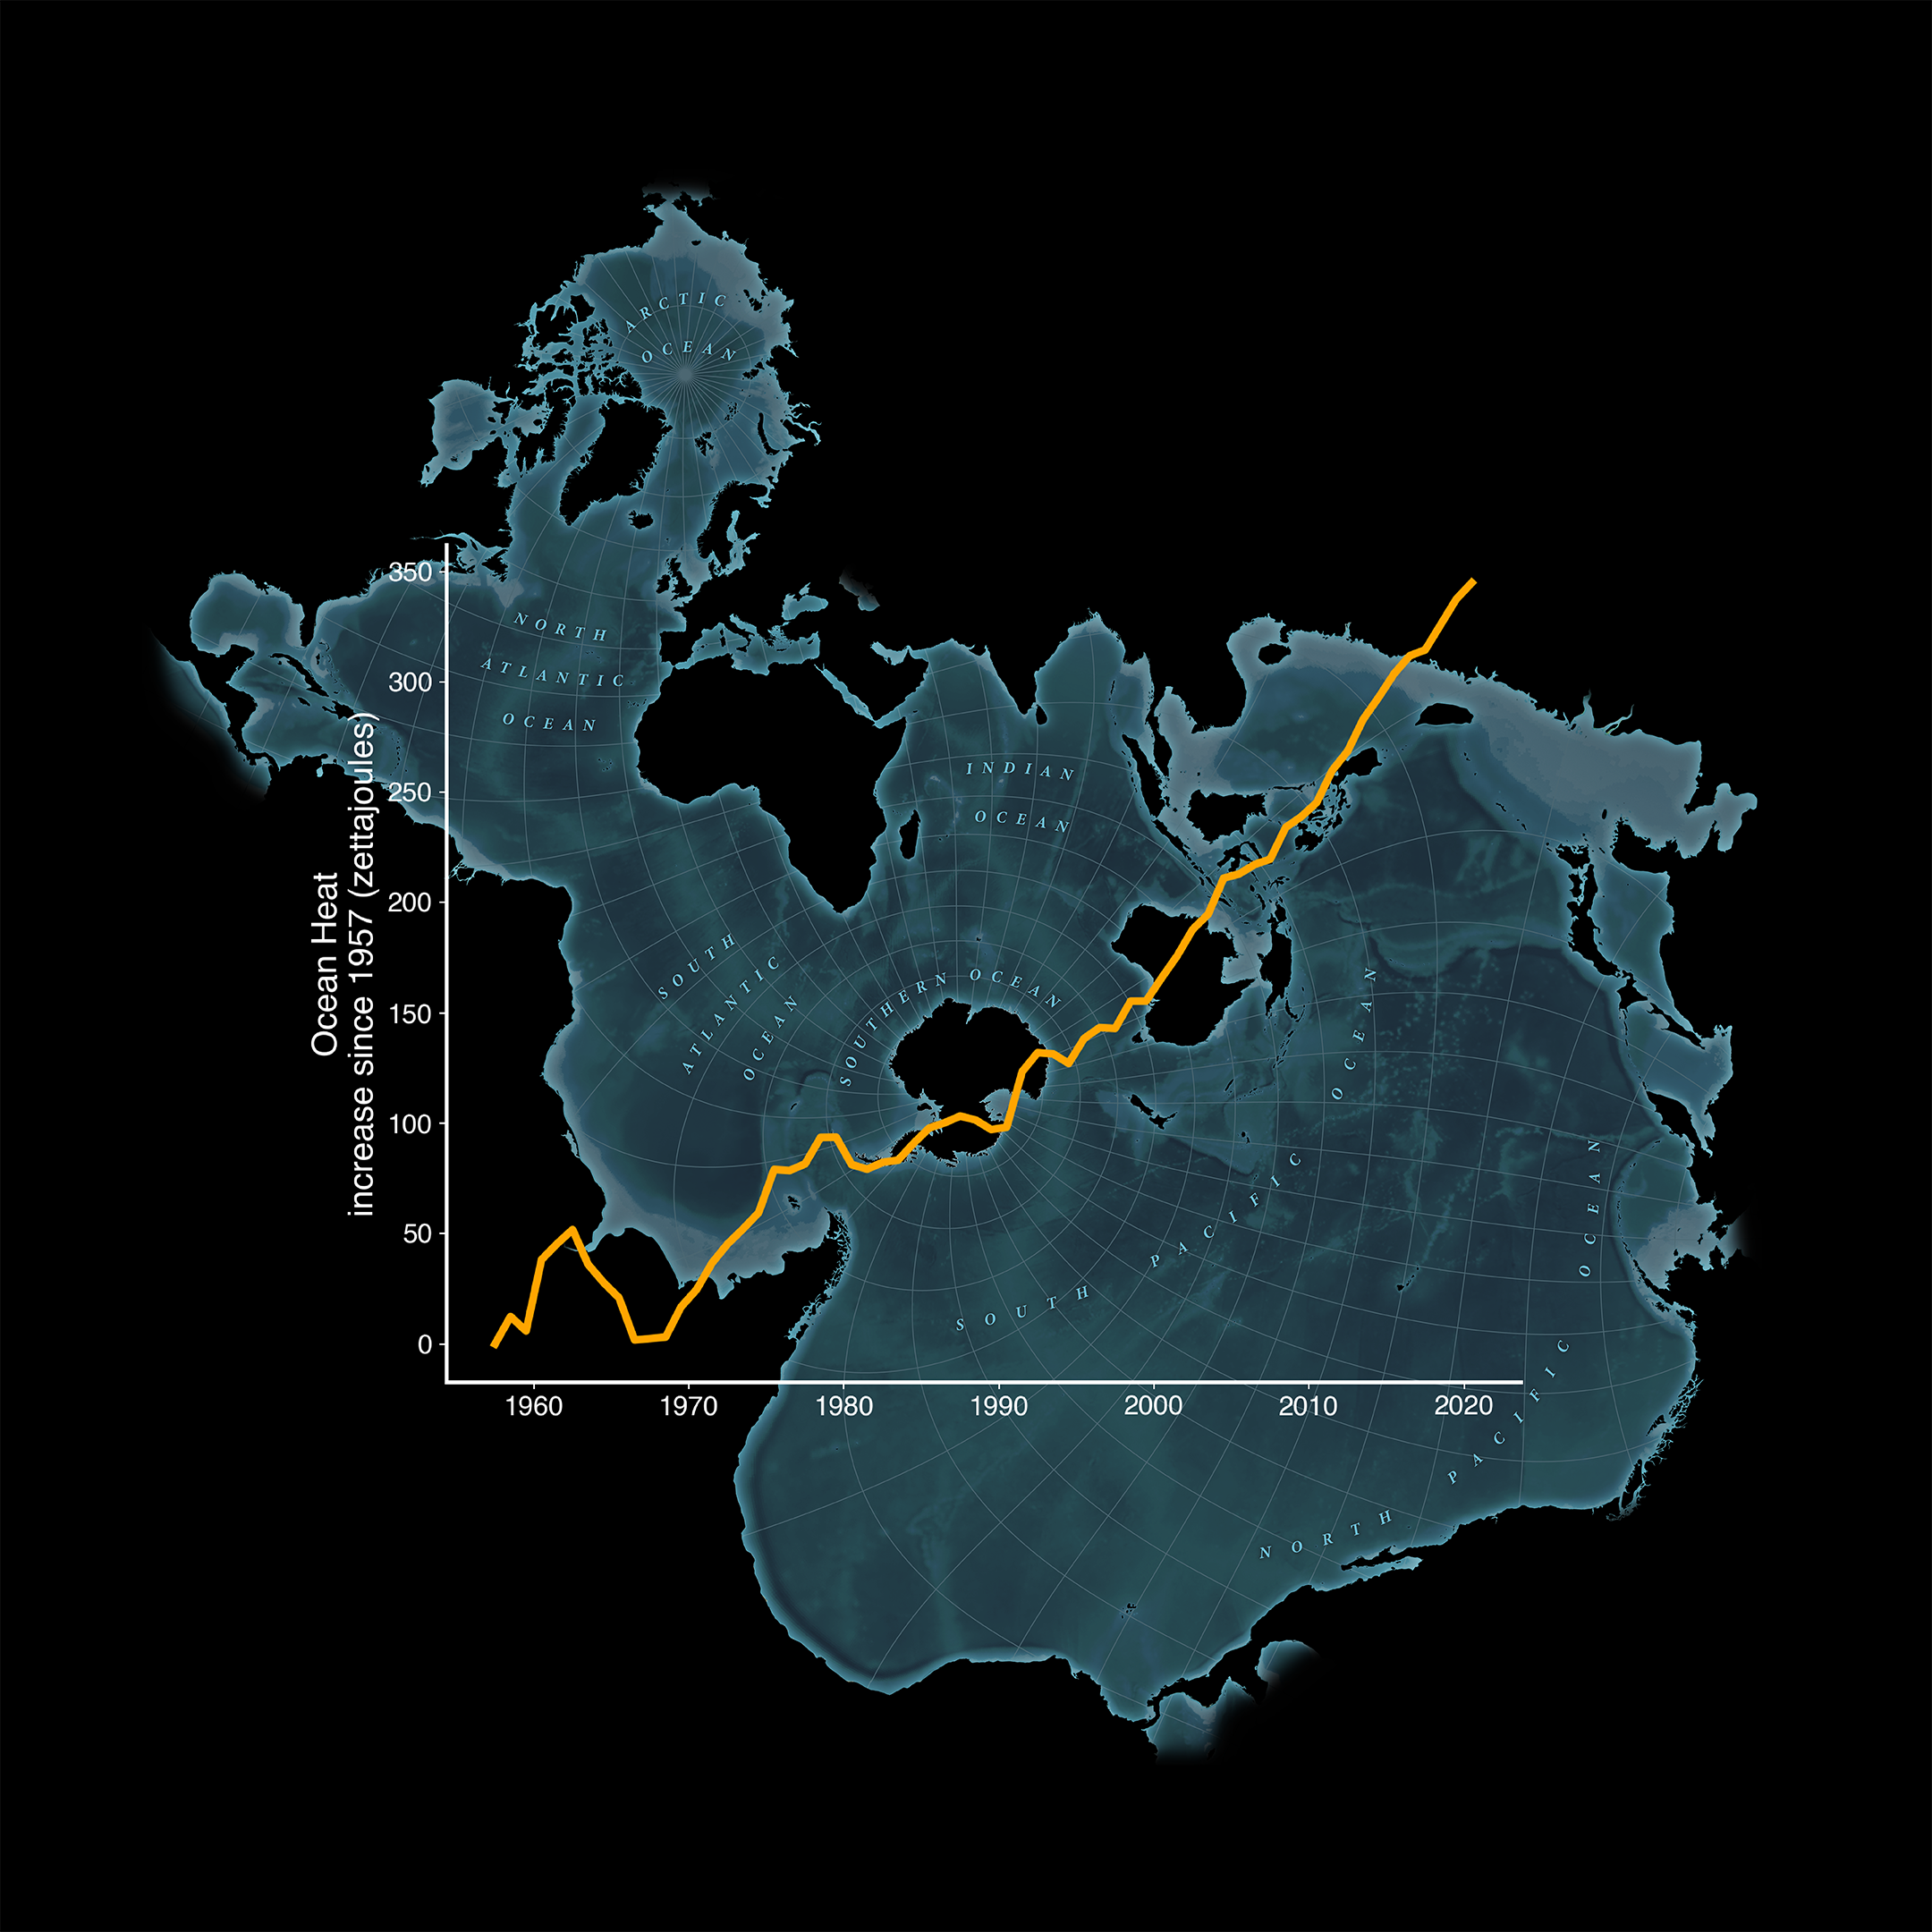
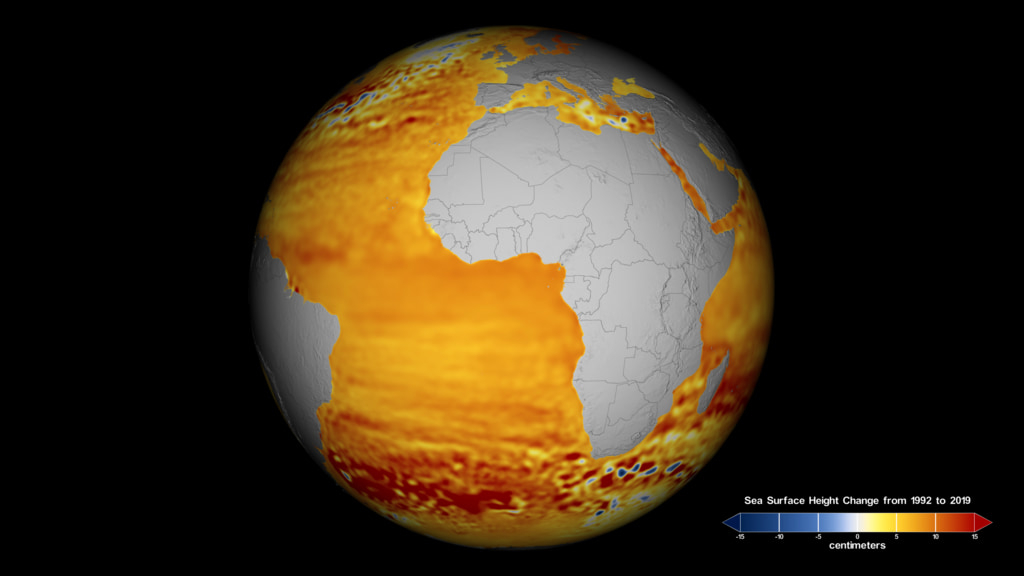
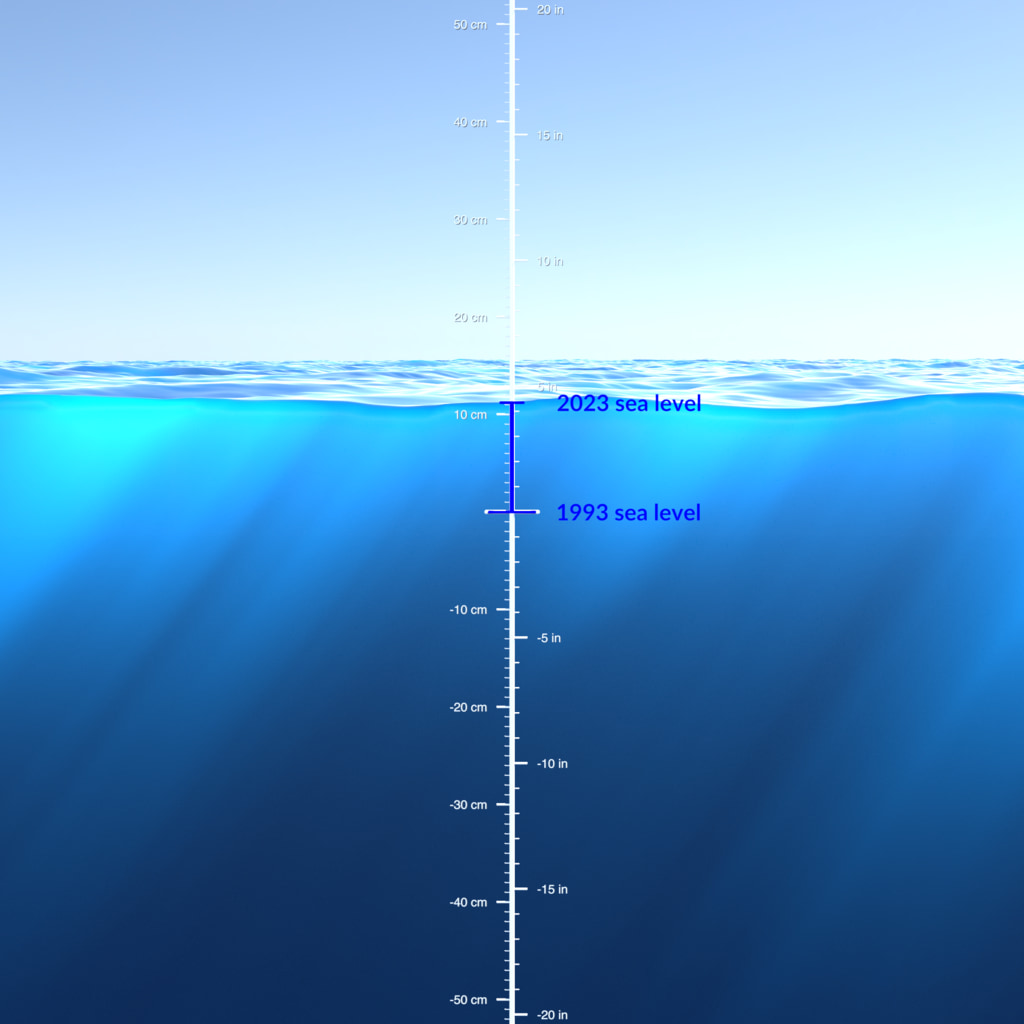
As the planet warms and polar ice melts, our global average sea level is rising. Although exact ocean heights vary due to local geography, climate over time, and dynamic fluid interactions with gravity and planetary rotation, scientists observe sea level trends by comparing measurements against a 20 year spatial and temporal mean reference. These visualizations use the visual metaphor of a submerged porthole window to observe how far our oceans rose between 1993 and 2022.
This visualization watches the global mean sea level change through a circular window. The blue mark on the ruler shows the exact measurements of the Integrated Multi-Mission Ocean Altimeter Data for Climate Research. The level of the animated water changes more smoothly, driven by a 60-day floating average of the same data.
When played on a 4K 85" display, the measurement markings in the video are accurate to the real world.
This visualization is the same as above, but without the circular window.
This visualization uses data collected by NOAA at a tidal gauge in San Francisco, California to show a much longer history of sea level change since the year 1900.
When played on a 67-inch tall screen (138-inch diagonal measurement), the measurement markings in the video are accurate to the real world.
Credits
Please give credit for this item to:
NASA's Scientific Visualization Studio
-
Visualizer
-
AJ Christensen
(SSAI)

-
AJ Christensen
(SSAI)
-
Technical support
- Laurence Schuler (ADNET Systems, Inc.)
- Ian Jones (ADNET Systems, Inc.)
Datasets used
-
GMSL (Global Mean Sea Level) [Integrated Multi-Mission Ocean Altimeters: TOPEX/Poseidon, Jason-1, OSTM/Jason-2, and Jason-3]
ID: 1185This data contains Global Mean Sea Level (GMSL) variations computed at the NASA Goddard Space Flight Center under the auspices of the NASA Sea Level Change program. The GMSL was generated using the Integrated Multi-Mission Ocean Altimeter Data for Climate Research (http://podaac.jpl.nasa.gov/dataset/MERGED_TP_J1_OSTM_OST_ALL_V51). It combines Sea Surface Heights from the TOPEX/Poseidon, Jason-1, OSTM/Jason-2, Jason-3, and Sentinel-6 Michael Freilich missions to a common terrestrial reference frame with all inter-mission biases, range and geophysical corrections applied and placed onto a georeferenced orbit. This creates a consistent data record throughout time, regardless of the instrument used. Note, the most recent estimates of GMSL (post March 28, 2022) derived from the Sentinel-6 Michael Freilich mission are preliminary as validation and reprocessing procedures for Sentinel-6 are ongoing.
Credit: GSFC. 2021. Global Mean Sea Level Trend from Integrated Multi-Mission Ocean Altimeters TOPEX/Poseidon, Jason-1, OSTM/Jason-2, and Jason-3 Version 5.1. Ver. 5.1 PO.DAAC, CA, USA. Dataset accessed [YYYY-MM-DD] at https://doi.org/10.5067/GMSLM-TJ151.
This dataset can be found at: http://podaac.jpl.nasa.gov/dataset/MERGED_TP_J1_OSTM_OST_ALL_V51
See all pages that use this dataset
Note: While we identify the data sets used on this page, we do not store any further details, nor the data sets themselves on our site.
Related
- ID: 5111
- ID: 4853
 Visualization
 - ID: 4821
 Visualization
Newer Versions
- ID: 5304

- ID: 5235
 Visualization
Release date
This page was originally published on Friday, June 16, 2023.
This page was last updated on Tuesday, February 18, 2025 at 12:13 AM EST.