Arctic Sea Ice 2020-2021, Domemaster Format
Full visualization, all elements, 30 fps.
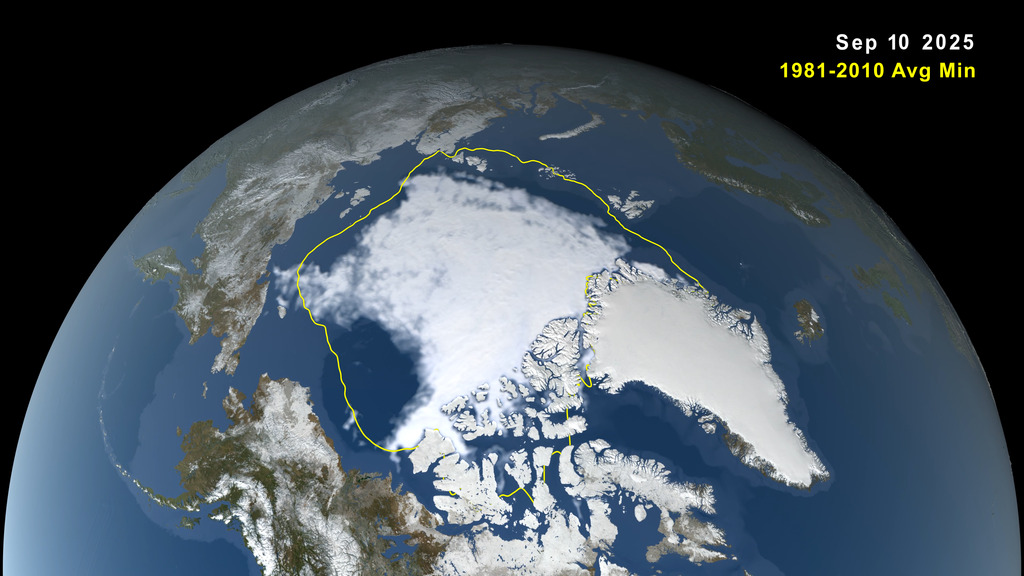
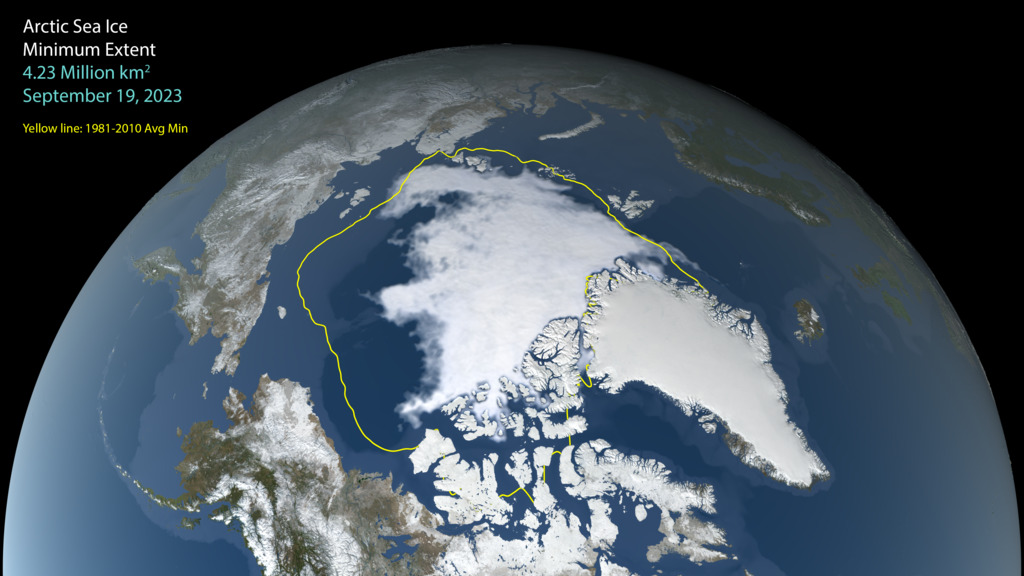
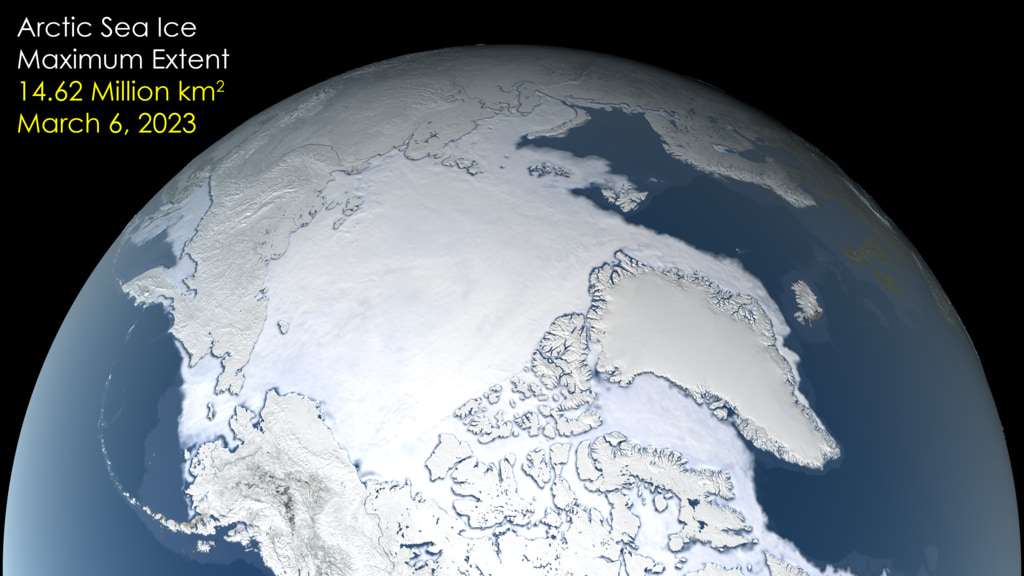
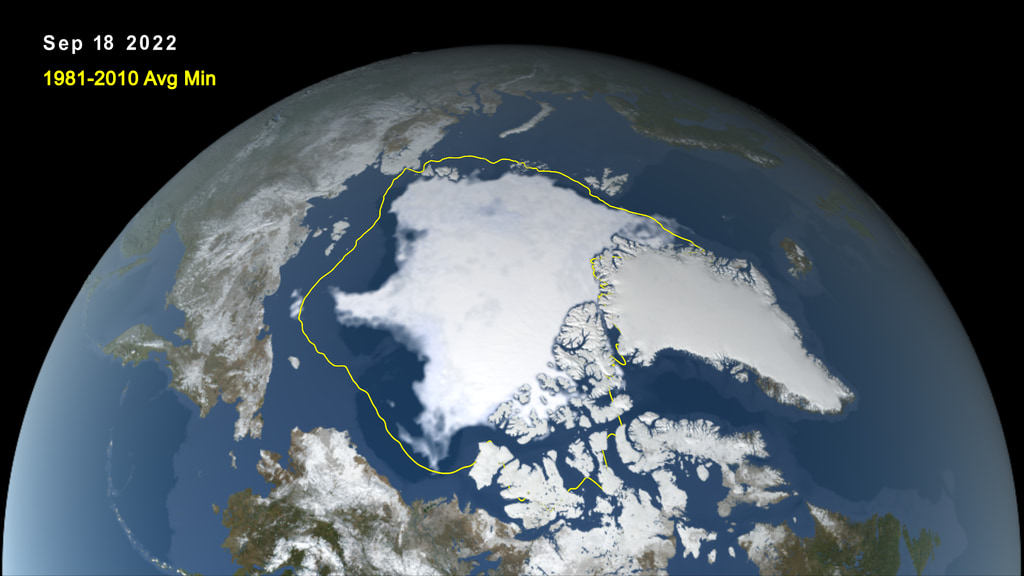
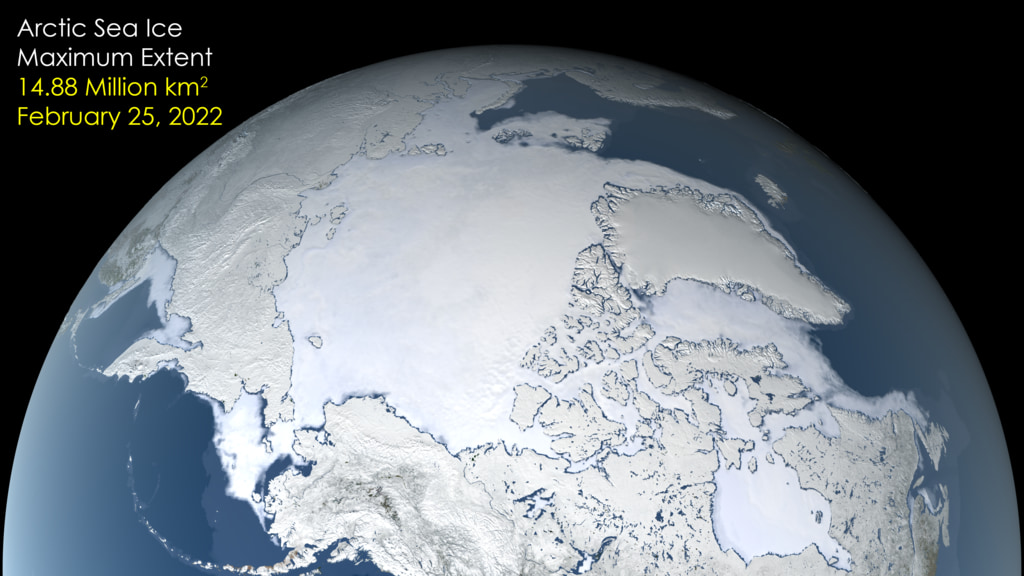
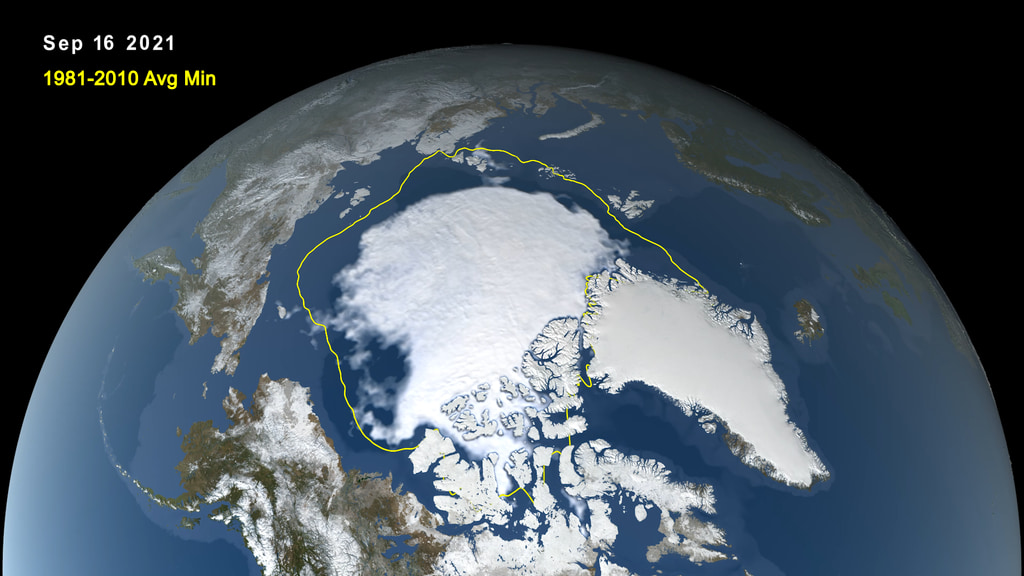
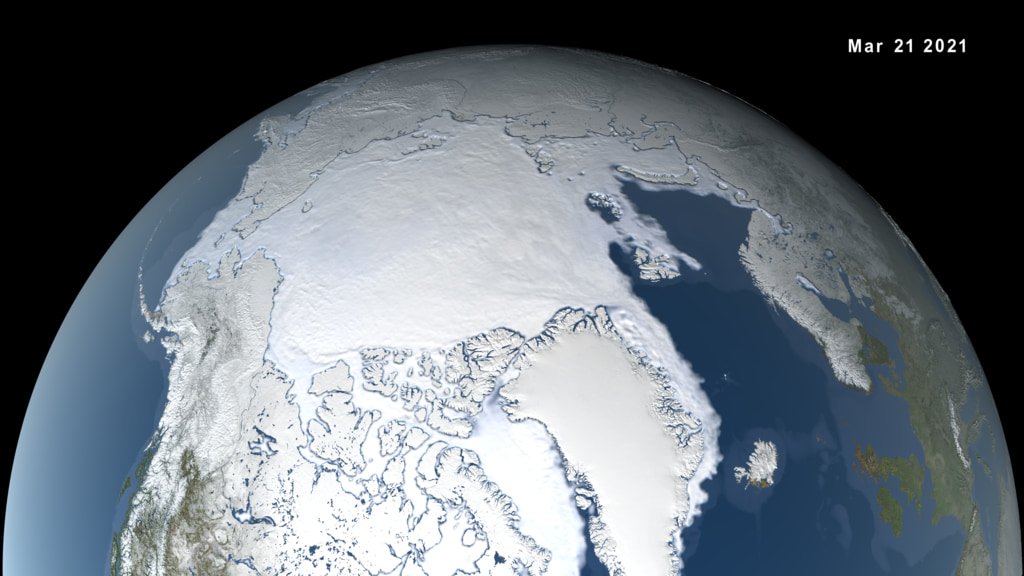
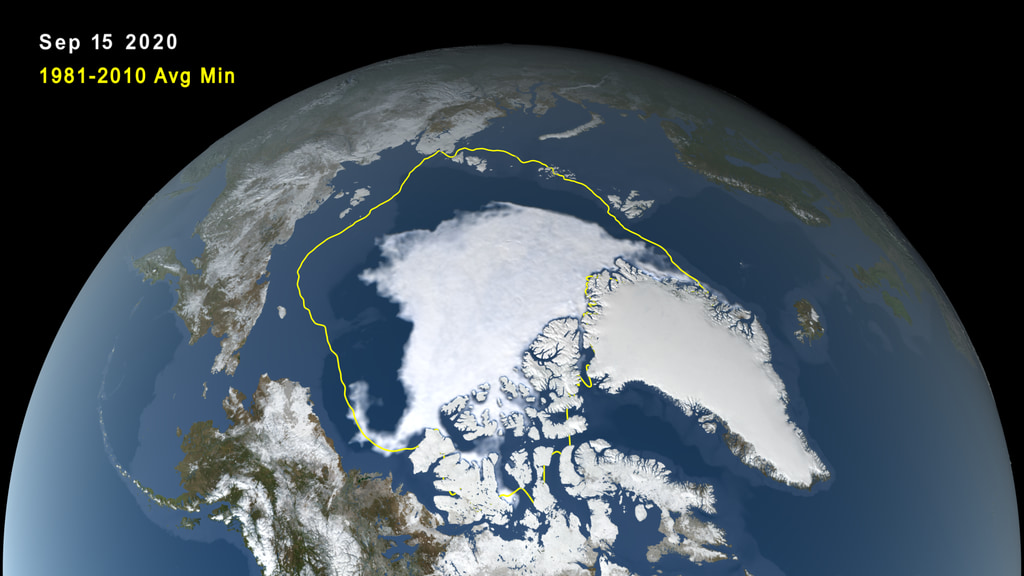
This visualzation depicts changes in Arctic sea ice extent during 2020 and 2021, in domemaster format, derived from NASA's AMSR2 instrument about JAXA's SHIZUKU (GCOM-W1) satellite. The video here is appropriate for use in planetarium shows and other hemispherical displays.
Earth layer only, 60 fps.
Star layer only, 60 fps.
Dates only, 60 fps.
Credits
Please give credit for this item to:
NASA's Scientific Visualization Studio
-
Visualizer
- Trent L. Schindler (USRA)
Datasets used
-
BMNG (Blue Marble: Next Generation) [Terra and Aqua: MODIS]
ID: 508Credit: The Blue Marble data is courtesy of Reto Stockli (NASA/GSFC).
This dataset can be found at: http://earthobservatory.nasa.gov/Newsroom/BlueMarble/
See all pages that use this dataset -
10 km Daily Sea Ice Concentration [SHIZUKU (GCOM-W1): AMSR2]
ID: 795Credit: AMSR2 data courtesy of the Japan Aerospace Exploration Agency (JAXA).
See all pages that use this dataset -
10 km Daily 89 GHz Brightness Temperature [SHIZUKU (GCOM-W1): AMSR2]
ID: 796Credit: AMSR2 data courtesy of the Japan Aerospace Exploration Agency (JAXA).
See all pages that use this dataset
Note: While we identify the data sets used on this page, we do not store any further details, nor the data sets themselves on our site.
Related
- ID: 5629
 Visualization
 - ID: 5583
 Visualization
 - ID: 5522
 Visualization
 - ID: 5382
 Visualization
 - ID: 5242
 Visualization
 - ID: 5162
 Visualization
 - ID: 5091
 Visualization
 - ID: 5030
 Visualization
 - ID: 4985
 Visualization
 - ID: 4941
 Visualization
 - ID: 4878
 Visualization
 - ID: 4860
 Visualization
Release date
This page was originally published on Saturday, May 22, 2021.
This page was last updated on Friday, October 22, 2021 at 9:31 AM EDT.