Climate Drivers
Data visualization of human and natural drivers of climate change for the period 1850-2018, showcasing data products from NASA's GISS Model E 2.1-G and observations.
Dr. Gavin Schmidt uses this visual to explain NASA's role in tracking and predicting climate at the 2021 COP26 conference - https://www.youtube.com/watch?v=CCAcKuJaJOg.
Data visualization of human and natural drivers of climate change for the period 1850-2018, showcasing data products from NASA's GISS Model E 2.1-G and observations. This version is created with a dark background.
Climate models simulate interactions of critical climate processes and drivers of change and aim to increase our understanding of Earth’s climate system. Measurements clearly demonstrate the changes to the Earth’s climate over the twentieth century up to the present day, and climate models are used to inform us about possible changes in the future climate. In the published articles titled GISS-E2.1: Configurations and climatology and CMIP6 historical simulations (1850–2014) with GISS-E2.1, the NASA GISS research team describe the computer climate model GISS-E.2.1 including its development over the last few years, summarize its main features, and compare it with previous versions and the observations. Notably, they describe how well the trends in multiple features of the climate are captured in the historical simulations from 1850 to 2014.
The data visualizations featured on this page present a high-level summary of the contributions of the NASA GISS-E2.1-G model to the Coupled Model Intercomparison Project (Phase 6) (CMIP6), while showcasing the human and natural drivers of climate change, which were part of the Detection and Attribution Model Intercomparison Project (DAMIP), a sub-project of CMIP6. The visualization includes spatial maps paired with multiplots. Assuming a grid-like structure, the visualization comprises two major parts:
Left:
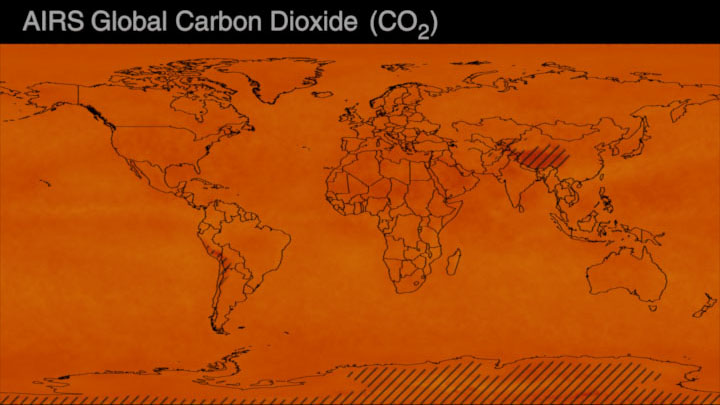
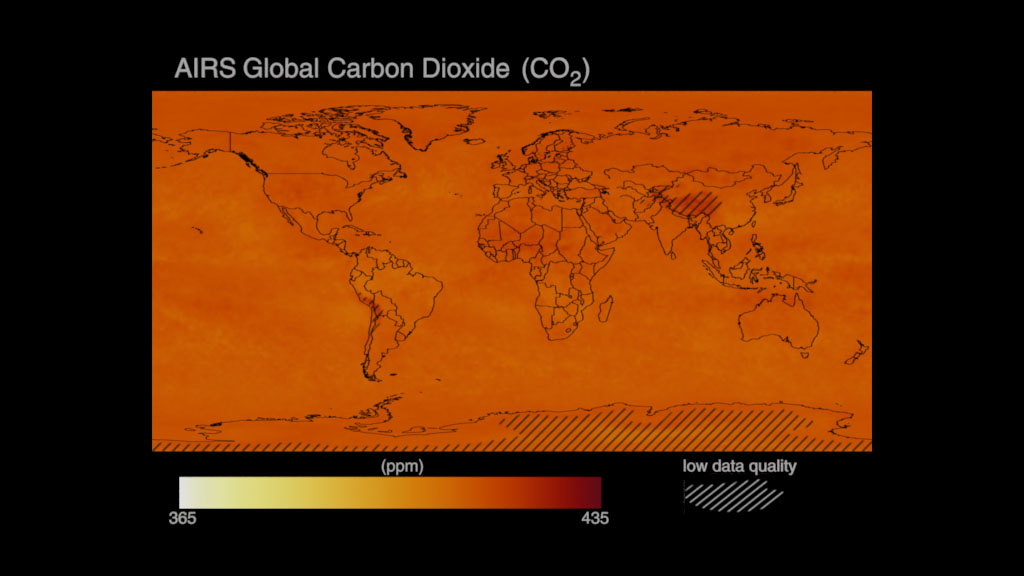
On the left we can see four separate maps in Wagner projection showing four distinct simulated datasets, displaying as anomalies. The anomalies are calculated using a baseline of 1951-1980. Top to bottom the datasets are: Mid-Stratosphere Temperature, Lower Stratosphere Temperature, Surface Temperature and Ocean Heat Content. The datasets present historical simulations with both natural and anthropogenic drivers for the period 1850-2014 and are paired with corresponding colormaps.
Middle and Right:
In the middle, synchronized multiplots for the same period track and visualize distinct drivers: natural (green), human (red), human and natural (blue), for each dataset. On the right, the Arctic Ice Area anomaly multiplot is followed by the visualization legends. As the timeline unfolds, we can see observations (in black for light background / in white for black background) starting to appear. These observations are used to evaluate the NASA GISS-E2.1-G model and while simulated data end in 2014, observations are plotted through 2018 (with the exception of Ocean Heat Content which is plotted through 2015).
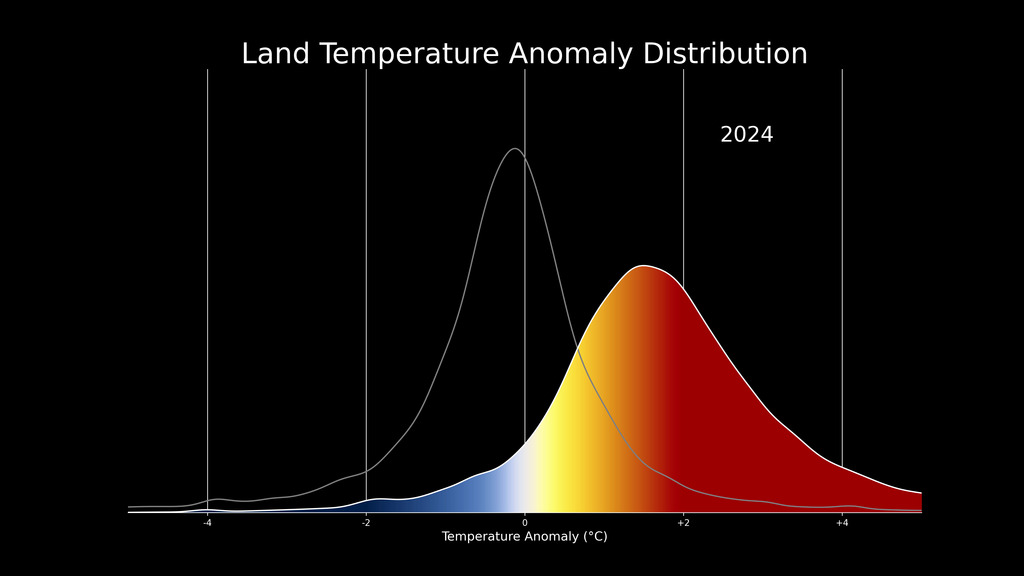
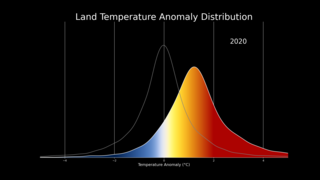
The historical timeline and the visualized maps show trends of stratospheric cooling, surface warming and significantly increased Arctic Ice Area loss, all of which are consistent with human forcing, especially rising greenhouse gas concentrations and ozone depletion. Therefore, it becomes apparent that the influence of human drivers is predominant in the climate system trends over the twentieth century and up to the present day.
The NASA GISS-E2.1 contributions to CMIP6 and its evaluation with observations offer new knowledge and serve our society by improving our understanding of the processes that govern climate change and climate interactions with natural and human activities for the past and the future.
Data Sources:
- NASA GISS ModelE-2-1-G for CMIP6: NASA-GISS GISS-E2.1G model output prepared for CMIP6 CMIP. Earth System Grid Federation. https://doi.org/10.22033/ESGF/CMIP6.1400
- Observations:
- Mid Stratosphere Temperature (SSU-Ch2): NOAA-STAR
https://www.star.nesdis.noaa.gov/smcd/emb/mscat/ - Lower Stratosphere Temperature (MSU-TLS): RSS http://www.remss.com/measurements/upper-air-temperature
- Surface Temperature: GISTEMP Team, 2021: GISS Surface Temperature Analysis (GISTEMP), version 4. NASA Goddard Institute for Space Studies. Dataset accessed 2020-07-29 at data.giss.nasa.gov/gistemp/
Lenssen, N., G. Schmidt, J. Hansen, M. Menne, A. Persin, R. Ruedy, and D. Zyss, 2019: Improvements in the GISTEMP uncertainty model. J. Geophys. Res. Atmos., 124, no. 12, 6307-6326, doi: 10.1029/2018JD029522 - Ocean Heat Content: NOAA NODC Pentadal 0-2000m Ocean Heat Content Time Series https://www.ncei.noaa.gov/access/global-ocean-heat-content/basin_heat_data.html
- Arctic Ice Area: Fetterer, F., K. Knowles, W. N. Meier, M. Savoie, and A. K. Windnagel. 2017, updated daily. Sea Ice Index, Version 3. Boulder, Colorado USA. NSIDC: National Snow and Ice Data Center. doi: 10.7265/N5K072F8
- Mid Stratosphere Temperature (SSU-Ch2): NOAA-STAR
The NASA Goddard Institute for Space Studies (GISS) is a laboratory in the Earth Sciences Division (ESD) of NASA's Goddard Space Flight Center (GSFC) and is affiliated with Columbia University’s Earth Institute and School of Engineering and Applied Science in New York.
The rest of this webpage offers layers associated with the development of this data-driven visualization.

This set of frames offers the entire visualization sequence with transparency for compositing purposes.
This set of frames offers the entire visualization sequence with transparency for compositing purposes. This version is recommended for dark background.
Credits
Please give credit for this item to:
NASA's Scientific Visualization Studio
-
Visualizers
-
Helen-Nicole Kostis
(USRA)

- Lori Perkins (NASA/GSFC)
-
Helen-Nicole Kostis
(USRA)
-
Scientist
-
Gavin A. Schmidt
(NASA/GSFC GISS)
-
Gavin A. Schmidt
(NASA/GSFC GISS)
-
Producers
-
Mark SubbaRao
(NASA/GSFC)
-
Peter H. Jacobs
(NASA/GSFC)
-
Mark SubbaRao
(NASA/GSFC)
-
Technical support
- Laurence Schuler (ADNET Systems, Inc.)
- Ian Jones (ADNET Systems, Inc.)
-
Project support
- Eric Sokolowsky (Global Science and Technology, Inc.)
- Kaushal Patel (SSAI)
Related papers
Miller, R. L., Schmidt, G. A., Nazarenko, L. S., Bauer, S. E., Kelley, M., Ruedy, R., et al. (2021). CMIP6 historical simulations (1850–2014) with GISS-E2.1. Journal of Advances in Modeling Earth Systems, 13, e2019MS002034. https://doi.org/10.1029/2019MS002034
Kelley, M., Schmidt, G. A., Nazarenko, L. S., Bauer, S. E., Ruedy, R., & Russell, G. L., et al. (2020). GISS-E2.1: Configurations and climatology. Journal of Advances in Modeling Earth Systems, 12, e2019MS002025. https://doi.org/10.1029/2019MS002025
Datasets used
-
GISTEMP [GISS Surface Temperature Analysis (GISTEMP)]
ID: 585The GISS Surface Temperature Analysis version 4 (GISTEMP v4) is an estimate of global surface temperature change. Graphs and tables are updated around the middle of every month using current data files from NOAA GHCN v4 (meteorological stations) and ERSST v5 (ocean areas), combined as described in our publications Hansen et al. (2010), Lenssen et al. (2019), and Lenssen et al. (2024).
Credit: Lenssen, N., G.A. Schmidt, M. Hendrickson, P. Jacobs, M. Menne, and R. Ruedy, 2024: A GISTEMPv4 observational uncertainty ensemble. J. Geophys. Res. Atmos., 129, no. 17, e2023JD040179, doi:10.1029/2023JD040179.
This dataset can be found at: https://data.giss.nasa.gov/gistemp/
See all pages that use this dataset
Note: While we identify the data sets used on this page, we do not store any further details, nor the data sets themselves on our site.
Related
- ID: 5603
 Visualization
 - ID: 5450
 Visualization
 - ID: 5452
- ID: 5207
 Visualization
 - ID: 5211
- ID: 5065
- ID: 5024
- ID: 5060
 Visualization
 - ID: 5025
- ID: 4990
- ID: 4964
 Visualization
 - ID: 4891
- ID: 4882
 Visualization
 - ID: 13791
 Produced Video
Release date
This page was originally published on Wednesday, June 30, 2021.
This page was last updated on Monday, June 23, 2025 at 12:13 AM EDT.