A newer version of this visualization is available.
Grand Average Precipitation Climatology

Grand Average Precipitation Climatology
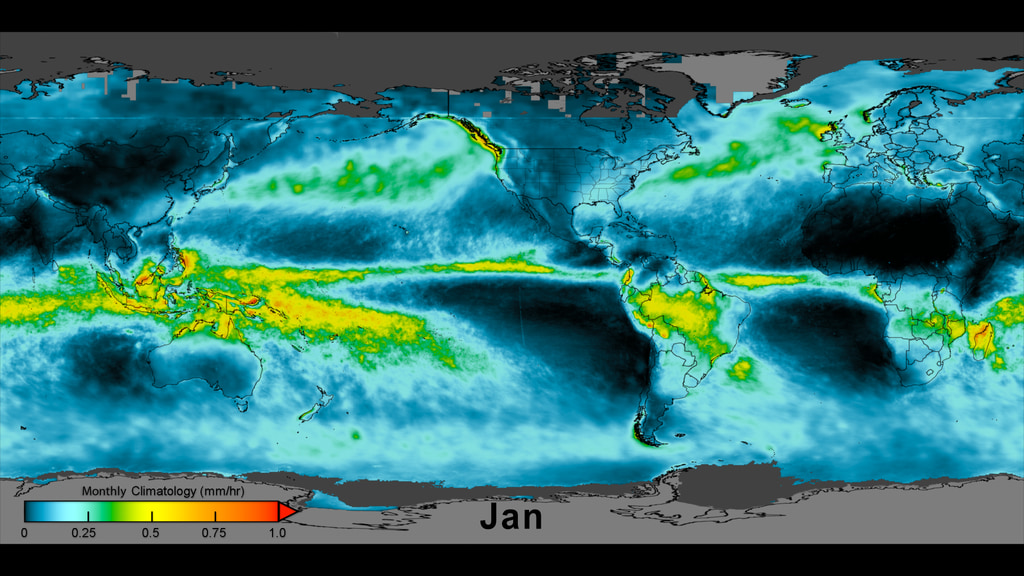
The Grand Average Climatology dataset covers June 2000 to May 2019. It shows the well-known structure of global precipitation: Intertropical Convergence Zone (ITCZ) near the Equator, South Pacific Convergence Zone (SPCZ) and smaller South Atlantic Convergence Zone (SACZ), relatively dry subtropical highs, and mid-latitude storm tracks. The relatively fine spatial resolution (0.1° lat./lon.) gives a more detailed picture than the previous NASA product (Tropical Rainfall Measuring Mission [TRMM] Multi-satellite Precipitation Analysis [TMPA], 0.25°), and its near-global coverage, better sampling in time, and improved algorithms provide wider coverage and more confidence in the results. The satellite input allows NASA researchers to estimate precipitation over both land and ocean, which networks of surface sensors do not provide. The most reliable estimates are provided over ocean; warm land is second-best, coastal areas are third, and snow/ice-covered regions are least certain.
Colorbar for the IMERG Grand Average Climatology dataset. Cooler colors are areas that receive very little rain. Warm colors receive more rain.
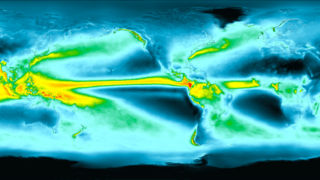
Alternative colorbar for the IMERG Grand Average Climatology with white outline and white text.
Credits
Please give credit for this item to:
NASA's Scientific Visualization Studio
-
Visualizer
-
Alex Kekesi
(Global Science and Technology, Inc.)

-
Alex Kekesi
(Global Science and Technology, Inc.)
-
Data visualizer
- Horace Mitchell (NASA/GSFC)
-
Scientists
-
George Huffman
(NASA/GSFC)
- Dalia B Kirschbaum (NASA/GSFC)
-
George Huffman
(NASA/GSFC)
-
Producers
- Ryan Fitzgibbons (USRA)
- Joy Ng (USRA)
-
Technical support
- Laurence Schuler (ADNET Systems, Inc.)
- Ian Jones (ADNET Systems, Inc.)
Datasets used
-
IMERG
ID: 863This dataset can be found at: http://pmm.nasa.gov/sites/default/files/document_files/IMERG_ATBD_V4.4.pdf
See all pages that use this dataset
Note: While we identify the data sets used on this page, we do not store any further details, nor the data sets themselves on our site.
Related
- ID: 4837
 Visualization
 - ID: 13348
![Complete transcript available.Music Credits: "Battle For Our Future" and "Wonderful Orbit" by Tom Furse Fairfax Cowan [PRS], "Transitions" by Ben Niblett [PRS] and Jon Cotton [PRS], "Emerging Discovery by "Rik Carter [PRS] from Killer Tracks](/vis/a010000/a013300/a013348/13348_DailyCycleOfRain_YouTube.00561_print.jpg) Produced Video
Produced Video
Newer Versions
- ID: 5237
 Visualization
Used as a Source In
- ID: 14617
 Produced Video
 - ID: 13909
 Produced Video
 - ID: 13839
![Music: Dawn Drone by Juan Jose Alba Gomez [SGAE]Complete transcript available.](/vis/a010000/a013800/a013839/Thumbnail_print.jpg)
Release date
This page was originally published on Wednesday, October 16, 2019.
This page was last updated on Sunday, January 5, 2025 at 11:52 PM EST.