Grand Average Precipitation Climatology (2000-2023)

Grand Average Precipitation Climatology ranging from June 2000 to May 2023
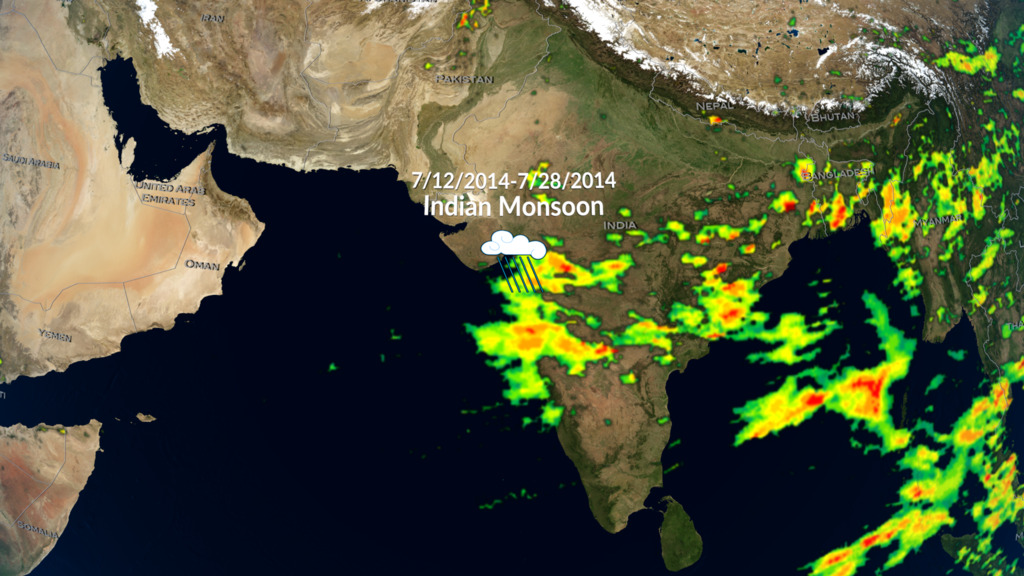
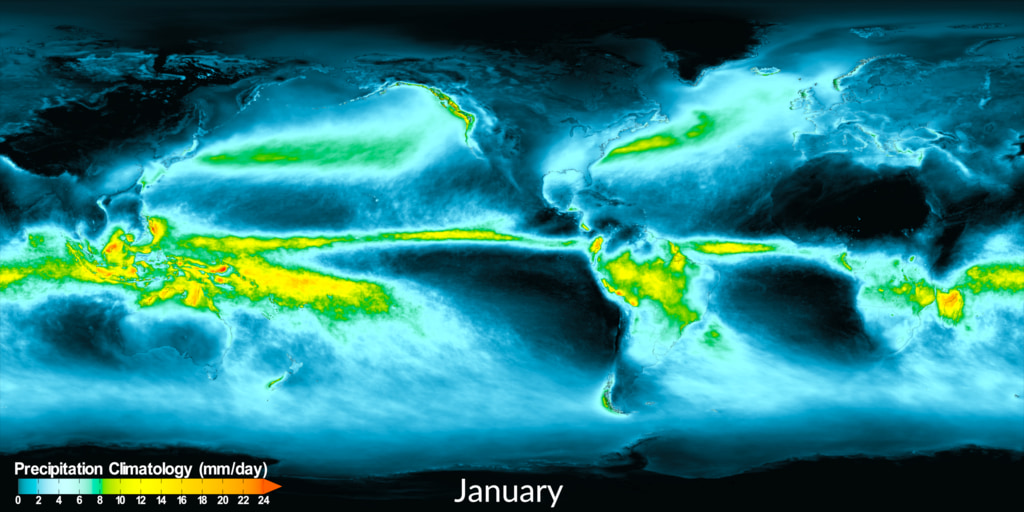
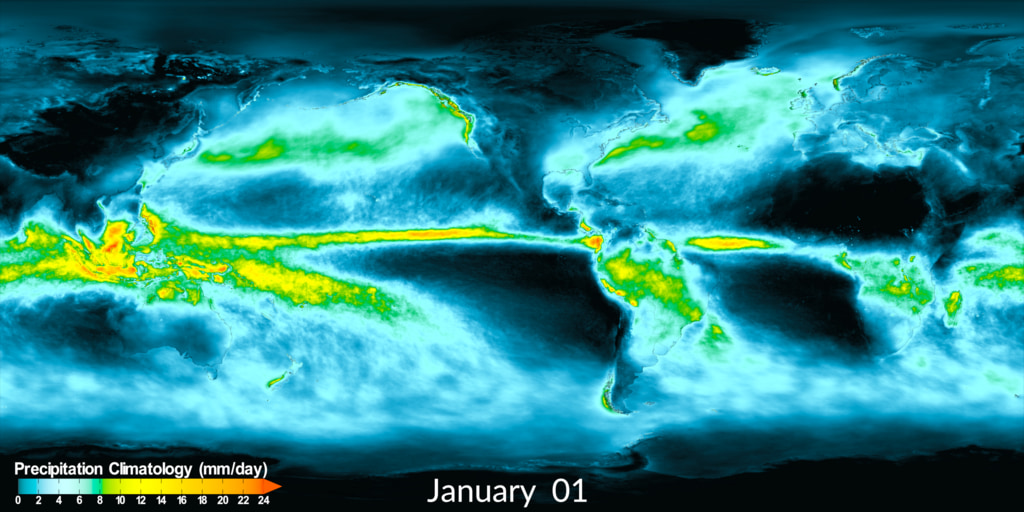
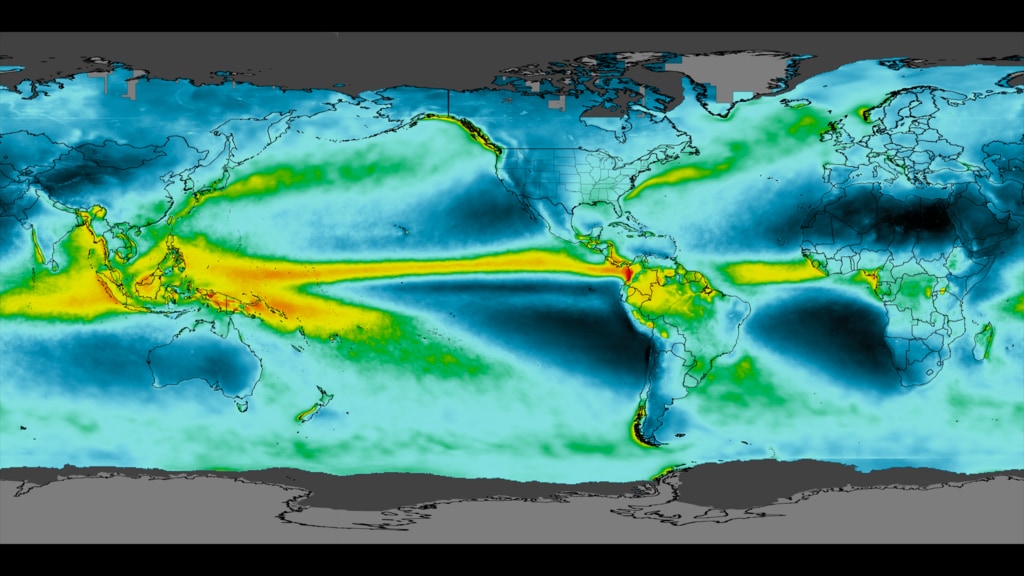
Newly improved Grand Average Precipitation Climatology dataset covering June 2000 to May 2023. The Grand Average Precipitation Climatology dataset takes the entire record of global precipitation from 2000 to 2023 and calculates the average precipitation for the entire globe. This new and improved product shows full global coverage, better sampling in time, and improved algorithms provide wider coverage and even more confidence in the results. The satellite input allows NASA researchers to estimate precipitation over both land and ocean, which networks of surface sensors do not provide. The most reliable estimates are provided over ocean; warm land is second-best, coastal areas are third, and snow/ice-covered regions are least certain.
Colorbar for the IMERG Grand Average Precipitation climatology dataset. Cooler colors are areas that receive very little rain. Warm colors receive more rain.
Alternative colorbar for the Grand Average Precipitation Climatology with white outline and white text.
Credits
Please give credit for this item to:
NASA's Scientific Visualization Studio
-
Visualizer
-
Alex Kekesi
(Global Science and Technology, Inc.)

-
Alex Kekesi
(Global Science and Technology, Inc.)
-
Scientists
-
George Huffman
(NASA/GSFC)
- Jackson Boon Sze Tan (USRA)
-
George Huffman
(NASA/GSFC)
-
Technical support
- Laurence Schuler (ADNET Systems, Inc.)
- Ian Jones (ADNET Systems, Inc.)
Datasets used
-
IMERG
ID: 863This dataset can be found at: http://pmm.nasa.gov/sites/default/files/document_files/IMERG_ATBD_V4.4.pdf
See all pages that use this dataset
Note: While we identify the data sets used on this page, we do not store any further details, nor the data sets themselves on our site.
Related
- ID: 5361
 Visualization
 - ID: 5241
 Visualization
 - ID: 5254
 Visualization
Older Versions
- ID: 4760
 Visualization
Release date
This page was originally published on Friday, March 29, 2024.
This page was last updated on Thursday, March 14, 2024 at 4:44 PM EDT.