Sea Surface Height Anomaly (SSHA) - Updated weekly
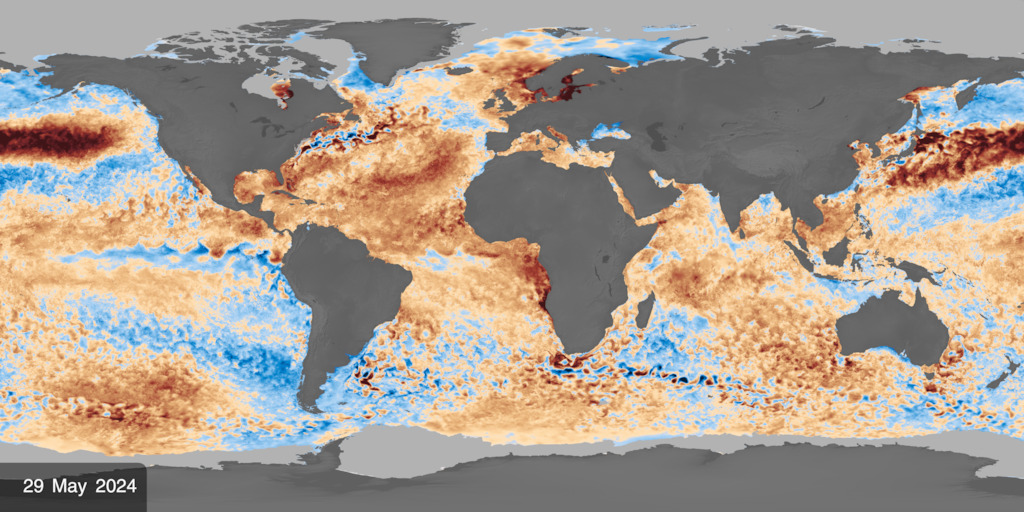
This visualization shows global sea surface height anomaly (SSHA) in an Atlantic-centered rectangular projection. Blue regions indicate lower-than-average sea surface heights, while yellow and red regions indicate higher-than-average heights. Daily sea ice is shown in light gray.

This image shows the most recent available sea surface height anomaly (SSHA) data in an Atlantic-centered rectangular projection. Blue regions indicate lower-than-average sea surface heights, while yellow and red regions indicate higher-than-average heights. Daily sea ice is shown in light gray.
These visualizations show sea surface height anomaly (SSHA), or how the height of the ocean surface differs from its long-term average, over the past two and a half years. The data are based on measurements collected by radar altimeters aboard NASA and partner satellites, including TOPEX/Poseidon, the Jason series, and Sentinel-6. These instruments measure the height of the ocean surface by timing how long radar signals take to travel from the satellite to the ocean and back. The observations are combined into global maps produced every seven days and interpolated to provide daily estimates of sea surface height anomaly.
Dark blue and light blue regions indicate lower-than-average sea surface heights, while yellow and red regions indicate higher-than-average heights. White represents values near zero, where sea surface height is close to its long-term average. Contour lines highlight patterns of equal sea surface height anomaly.
The visualizations also include daily sea ice data to provide additional context in the polar regions. Sea ice is shown in light gray.
The visualizations on this page use daily interpolated SSHA data derived from weekly satellite observations. They are automatically updated as new data becomes available.
This visualization shows global sea surface height anomaly (SSHA) in a Pacific-centered rectangular projection. Blue regions indicate lower-than-average sea surface heights, while yellow and red regions indicate higher-than-average heights. Daily sea ice is shown in light gray.
This image shows the most recent available sea surface height anomaly (SSHA) data in a Pacific-centered rectangular projection. Blue regions indicate lower-than-average sea surface heights, while yellow and red regions indicate higher-than-average heights. Daily sea ice is shown in light gray.
This visualization shows global sea surface height anomaly (SSHA) using a Robinson map projection centered on the Atlantic Ocean. Blue regions indicate lower-than-average sea surface heights, while yellow and red regions indicate higher-than-average heights. Daily sea ice is shown in light gray.
This image shows the most recent available sea surface height anomaly (SSHA) data using a Robinson map projection centered on the Atlantic Ocean. Blue regions indicate lower-than-average sea surface heights, while yellow and red regions indicate higher-than-average heights. Daily sea ice is shown in light gray.
This visualization shows global sea surface height anomaly (SSHA) using a Pacific-centered Robinson map projection. Blue regions indicate lower-than-average sea surface heights, while yellow and red regions indicate higher-than-average heights. Daily sea ice is shown in light gray.
This image shows the most recent available sea surface height anomaly (SSHA) data using a Pacific-centered Robinson map projection. Blue regions indicate lower-than-average sea surface heights, while yellow and red regions indicate higher-than-average heights. Daily sea ice is shown in light gray.
This visualization shows global sea surface height anomaly (SSHA) in an Atlantic-centered rectangular projection. Blue regions indicate lower-than-average sea surface heights, while yellow and red regions indicate higher-than-average heights. Daily sea ice is shown in light gray. This version omits the on-screen date labels and color legend.
This visualization shows global sea surface height anomaly (SSHA) in a Pacific-centered rectangular projection. Blue regions indicate lower-than-average sea surface heights, while yellow and red regions indicate higher-than-average heights. Daily sea ice is shown in light gray. This version omits the on-screen date labels and color legend.
This visualization shows global sea surface height anomaly (SSHA) in an Atlantic-centered rectangular projection. Blue regions indicate lower-than-average sea surface heights, while yellow and red regions indicate higher-than-average heights. Daily sea ice is shown in light gray. This version omits contour lines, date labels, and the color legend.
Credits
-
Data visualizer
- Kel Elkins (Science and Technology Corporation)
-
Scientists
-
Josh Willis
(JPL)

-
Benjamin Hamlington
(NASA/JPL)
-
Josh Willis
(JPL)
Series
This page can be found in the following series:Datasets used
-
SSHA (Sea Surface Height Anomaly) [OSTM/Jason-2: Poseidon-3]
ID: 891
Note: While we identify the data sets used on this page, we do not store any further details, nor the data sets themselves on our site.
Related
- ID: 5504
 Visualization
- ID: 5176
 Visualization
- ID: 5101
 Visualization
Used as a Source In
- ID: 5683
 Visualization
Release date
This page was originally published on Wednesday, August 5, 2026.
This page was last updated on Monday, November 9, 2026 at 5:21 PM EST.