The Hiawatha Impact Crater
The series of visualizations below are derived from satellite imagery and radar sounding. They portray both the location and size of the 31-kilometer-wide impact crater beneath Hiawatha Glacier. They also portray the structure of the glacier ice that flows into and fills the crater.
The Hiawatha impact crater was first suspected to exist in the summer of 2015, from examination of a compilation of Greenland's sub-ice topography radar measurements made by NASA over two decades. The visualizations of the subsurface shown below are derived from a spring 2016 airborne survey by Germany's Alfred Wegener Institute, using a new ultrawideband radar sounder developed by the Center for Remote Sensing of Ice Sheets at The University of Kansas. Subsequent helicopter visits to the deglaciated terrain in front of Hiawatha Glacier by scientists from the Natural History Museum in Denmark recovered sediment samples from the main river that discharges water from beneath Hiawatha Glacier, through the northwestern rim breach. Laboratory examination revealed that these sediment samples contained shocked quartz and elevated platinum-group-element concentrations, both signs that the sediment records evidence of the impact of an iron asteroid more than one kilometer wide. The Hiawatha impact crater is potentially one of the youngest large impact craters on Earth.
In the visualizations below, the elevation of the topography of the bed, the ice surface and the radar curtains have been exaggerated ten times in order to better illustrate their structure.
Starting from a global view, this visualization zooms into Inglefield Land in northwest Greenland and shows the location of Hiawatha Glacier. The surface of the ice sheet is then faded away to show the impact crater beneath the ice sheet. A red cylinder shows the best-fit rim of the impact crater and a measuring stick shows the diameter as more than 31 kilometers across. The size of the crater is compared to the cities of Washington, DC and Paris, France.
This video is also available on our YouTube channel.
This visualization shows how Germany's Alfred Wegener Institute's (AWI) Polar 6 aircraft (a DC-3T) collected radar data over the Hiawatha impact crater. Ice-penetrating radar sends radio waves downward into the ice sheet and measures the energy reflected back from within the ice sheet and the ground beneath. The radar data detects layers in the ice generated by climate events in the past. The radar data ("radargrams") is then displayed on curtains in the location where it was observed showing the layers in the ice.
As the plane flies inland over Hiawatha Glacier, the ice sheet is cut away, leaving the radargram on the interior cutting plane. At this point, half of the depression of the Hiawatha impact crater is visible. A green grid fades in over the surface of ice sheet showing the location of the flights that collected the radar data in spring 2016 by AWI. The entire ice-sheet surface fades away and the full crater is visible as arrows point out the locations of the peaks in the central uplift and a red cylinder shows the best-fit rim of the impact crater. Radargram "curtains" fade on and are subsequently removed two at a time to allow examination of the structure of the ice that fills the crater. Note that the lower layers of ice near the crater floor appear disturbed, while the upper layers appear smooth and undisturbed.
This video is also available on our YouTube channel.
This visualization begins by showing the bed of Hiawatha impact crater beneath the Greenland ice sheet. The surface of the ice sheet slowly fades on over the impact crater and we pull away from the Hiawatha glacier showing its location in Inglefield Land in northwest Greenland. The animation ends with a view of the Arctic, Greenland and Europe.
This video is also available on our YouTube channel.
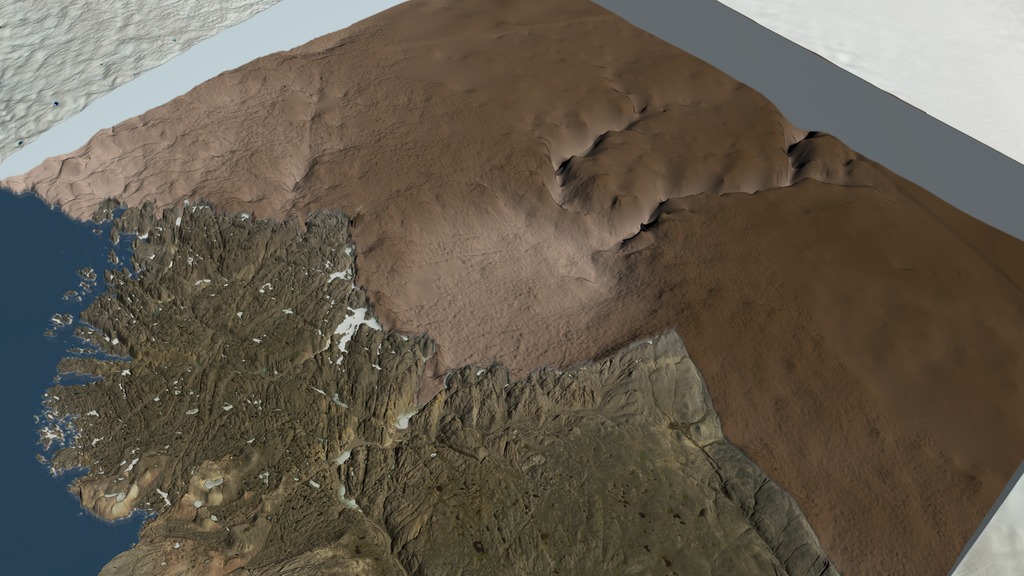
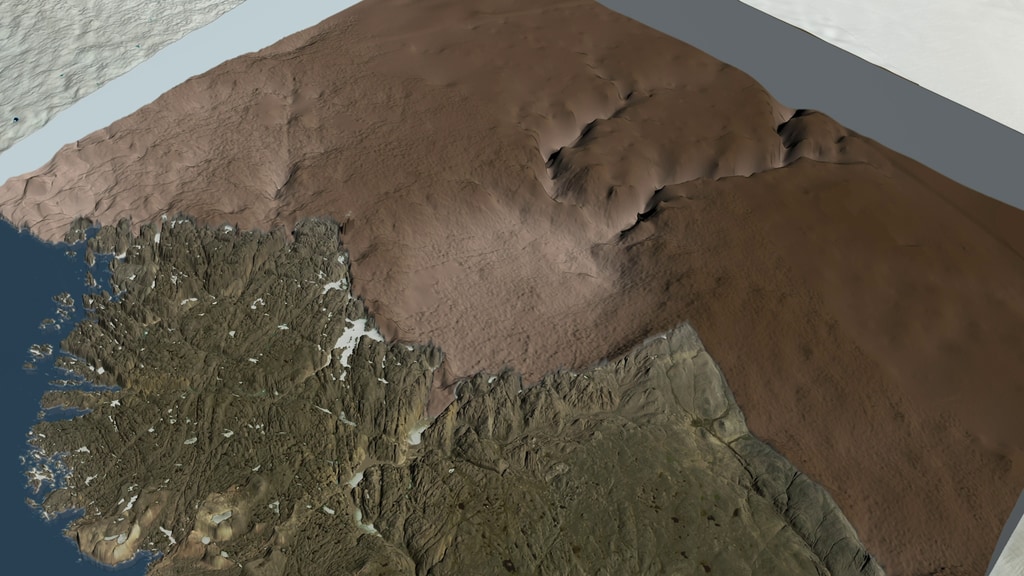
This visualization shows the bed topography of the Hiawatha impact crater lying beneath the Greenland Ice Sheet near Inglefield Land. This visualization is a subset of the first visualization above, but without the wall indicating the crater rim, the size scale, or the city insets that were shown for size comparisons.
This video is also available on our YouTube channel.
This visualization begins by showing the bed topography beneath the Greenland Ice Sheet and the Hiawatha impact crater. The topography in this region was measured using ice-penetrating radar mounted on an aircraft. The radar system sends radio waves downward into the ice sheet and collects the data reflected back from within the ice sheet and the ground beneath. The reflected data depicts the historical layers in the ice that were generated by the annual seasonal cycles of growth and melt. Here the radar data is displayed on curtains in the location where it was observed showing the layers in the ice that record the history of the ice sheet similar to the way that rings on a felled tree show the growing seasons in a tree trunk. Curtains of radar data closest to the camera are sequentially removed as we fly through the crater basin in order to give a close-up view of the interior layers of ice.
This visualization is identical to a subset of the second one above showing radar data displayed on curtains except that this version has no labels added.
This video is also available on our YouTube channel.
This region of the Hiawatha impact crater has been studied using ice-penetrating radar. The ice radar sends out radio waves into the ice sheet and collects the data reflected back from within the ice sheet and the ground beneath. The reflected data depicts the historical layers in the ice generated by the annual seasonal cycles of growth and melt. The radar data is then displayed on curtains in the location where it was observed showing the layers in the ice that record its history. This visualization shows the bed beneath the Hiawatha Glacier and some of the radar curtains. These layers visible in the radar curtain record the history of the ice sheet from the oldest ice near the bed to the recent year's layers found near the surface. Note the disturbance in the layers found close to the bed.
This video is also available on our YouTube channel.
This visualization begins by flying over the Greenland Ice Sheet heading northwest towards the coast of Greenland and Nares Strait. As we near the Hiawatha Glacier, a square section of the ice surface fades away to show the topography of the Hiawatha impact crater beneath the ice sheet.
This video is also available on our YouTube channel.

This image shows some of the radar data from the airborne survey of the Hiawatha crater displayed on opaque curtains.
This image shows another view of some radar data from the airborne survey of the Hiawatha crater displayed on opaque curtains. Labels indicate layers in the ice sheet. The blue arrow points to one of the central peaks.
A still image showing the Greenland Ice Sheet and the Hiawatha Glacier.
A still image showing the ice sheet removed in the region around the Hiawatha Glacier. The bed topography under the ice clearly shows the Hiawatha crater.
A still iamge showing the distance across the Hiawatha crater
A still image showing a comparison of the size of the Hiawatha crater to Washington, DC.
A still image showing a comparison of the size between the Hiawatha crater and Paris, France. The region shown is limited by the Paris super-périphérique (A86) ring road around the city.
A still image showing the crater beneath the ice sheet partially removed. The radar data is shown on the facing removed surface. The flight lines from the survey of the area are shown in green.
An image showing the AWI radar data collected by the airborne survey on semi-transparent curtains. Arrows pointing to the central peaks of the crater are visible through the curtains.
A still image of the crater beneath the Hiawatha Glacier, outlined with a semi-transparent red cylinder. The central peaks of the crater are identified by blue arrows.
This image shows another view of some radar data from the airborne survey of the Hiawatha crater displayed on opaque curtains. A blue bar indicates the height of one kilometer. The blue arrow points to one of the central peaks.
Credits
Please give credit for this item to:
NASA's Scientific Visualization Studio
-
Visualizers
- Cindy Starr (Global Science and Technology, Inc.)
- Greg Shirah (NASA/GSFC)
- Lori Perkins (NASA/GSFC)
- Ernie Wright (USRA)
-
Scientists
- Joe MacGregor (NASA/GSFC)
- Mark Fahnestock (University of Alaska)
- Kurt Kjær (University of Copenhagen)
-
Producer
- Jefferson Beck (USRA)
-
Project support
- Joycelyn Thomson Jones (NASA/GSFC)
- Leann Johnson (Global Science and Technology, Inc.)
- Eric Sokolowsky (Global Science and Technology, Inc.)
-
Technical support
- Laurence Schuler (ADNET Systems, Inc.)
- Ian Jones (ADNET Systems, Inc.)
Release date
This page was originally published on Wednesday, November 14, 2018.
This page was last updated on Monday, July 15, 2024 at 12:05 AM EDT.
Datasets used in this visualization
-
BMNG (Blue Marble: Next Generation) [Terra and Aqua: MODIS]
ID: 508Credit: The Blue Marble data is courtesy of Reto Stockli (NASA/GSFC).
This dataset can be found at: http://earthobservatory.nasa.gov/Newsroom/BlueMarble/
See all pages that use this dataset -
Land Surface Temperature [Terra and Aqua: MODIS]
ID: 557 -
True Color (Band Combination 2,3,4) [Landsat-8: OLI]
ID: 784 -
10 km Daily Sea Ice Concentration [SHIZUKU (GCOM-W1): AMSR2]
ID: 795Credit: AMSR2 data courtesy of the Japan Aerospace Exploration Agency (JAXA).
See all pages that use this dataset -
10 km Daily 89 GHz Brightness Temperature [SHIZUKU (GCOM-W1): AMSR2]
ID: 796Credit: AMSR2 data courtesy of the Japan Aerospace Exploration Agency (JAXA).
See all pages that use this dataset -
Greenland Mass Conservation Dataset - Surface Elevation
ID: 853This dataset can be found at: http://sites.uci.edu/morlighem/dataproducts/mass-conservation-dataset/
See all pages that use this dataset -
Greenland Mass Conservation Dataset - Bed Topography
ID: 854This dataset can be found at: http://sites.uci.edu/morlighem/dataproducts/mass-conservation-dataset/
See all pages that use this dataset -
MODIS Mosaic of Greenland (MOG) Image Map [Terra: MODIS]
ID: 858 -
ArcticDEM 5-meter Digital Surface Model Release 4 (ArcticDEM 5-meter Digital Surface Model Release 4) [WorldView-1, WorldView-2, and WorldView-3, GeoEye-1]
ID: 973This dataset can be found at: https://www.pgc.umn.edu/data/arcticdem/
See all pages that use this dataset -
Canadian Digital Elevation Data
ID: 974 -
Hiawatha Glacier Gridded Bed Topography
ID: 975Credit: Hiawatha Glacier Gridded Bed Topography data is courtesy of Mathieu Morlighem (UCI).
See all pages that use this dataset -
Alfred Wegener Institute (AWI) Airborne Radar Survey of Hiawatha Glacier
ID: 976Airborne radar survey of the region around the Hiawatha glacier.
See all pages that use this dataset
Note: While we identify the data sets used in these visualizations, we do not store any further details, nor the data sets themselves on our site.
Alternate Versions
- ID: 4706
 Visualization
Used as a Source In
- ID: 4742
 Visualization
 - ID: 12941
 Produced Video