2005-2014 NO₂ Hyperwall Shows
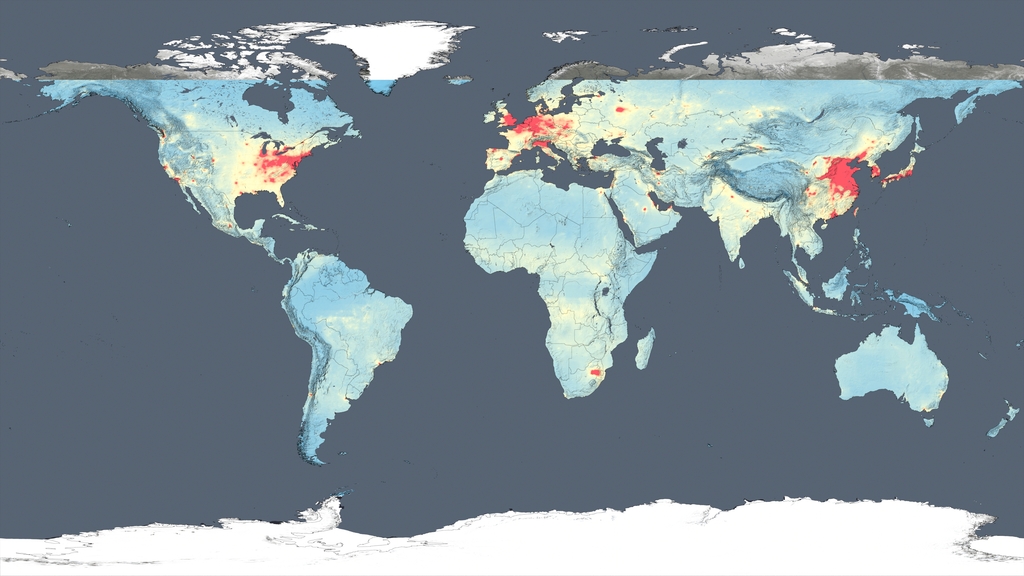
Global NO2 Concentrations, Endpoint Fade 2005, 2014
A collection of hyperwall shows used in the 2015 meeting of the American Geophysical Union.
For context and additional information: NASA Images Show Human Fingerprint on Global Air Quality
Global NO2 Concentrations, Animated 2005-2014

United States Absolute Trend
China Absolute Trend
Europe Absolute Trend
Middle East Absolute Trend
South Africa Absolute Trend
Credits
Please give credit for this item to:
NASA's Scientific Visualization Studio
-
Visualizer
- Trent L. Schindler (USRA)
-
Scientists
- Bryan Duncan (NASA/GSFC)
- Lok Lamsal (USRA)
-
Writer
- Ellen T. Gray (ADNET Systems, Inc.)
-
Producer
- Kayvon Sharghi (USRA)
Missions
This page is related to the following missions:Datasets used
-
[Aura: OMI]
ID: 147
Note: While we identify the data sets used on this page, we do not store any further details, nor the data sets themselves on our site.
Sources
- ID: 4412
Release date
This page was originally published on Monday, December 14, 2015.
This page was last updated on Sunday, February 2, 2025 at 10:24 PM EST.