Painting the World with Water (New Colorbar)
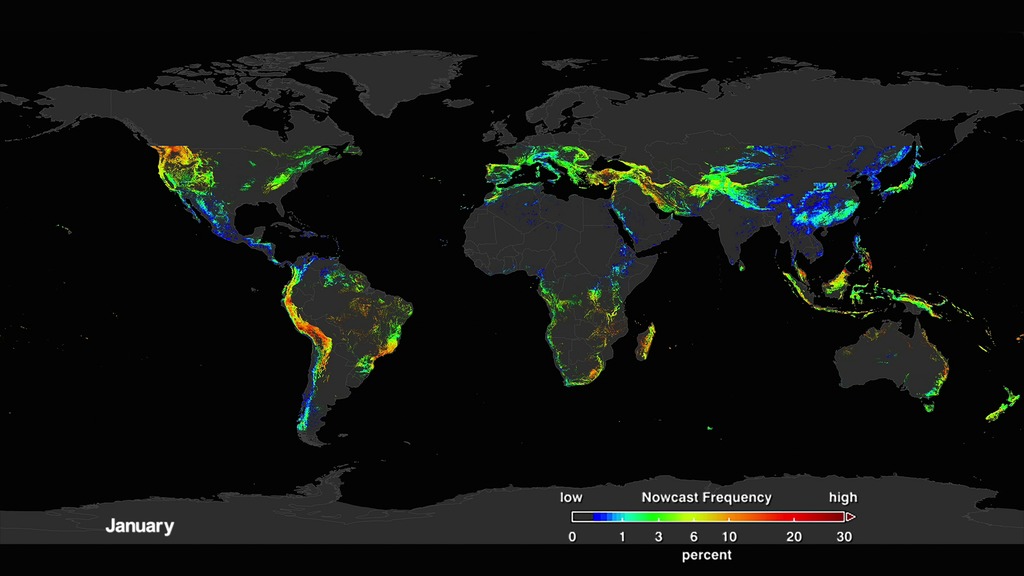
An animation depicting the build-up of precipitation data on a flat map from the Global Precipitation Measurement constellation of satellites, resulting in the IMERG global precipitation data set.
This video is also available on our YouTube channel.
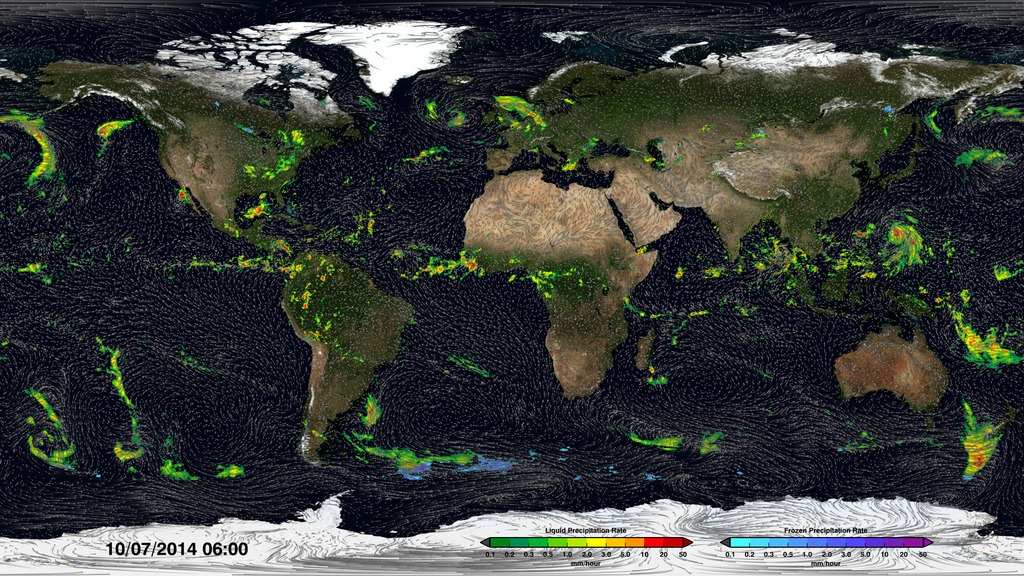
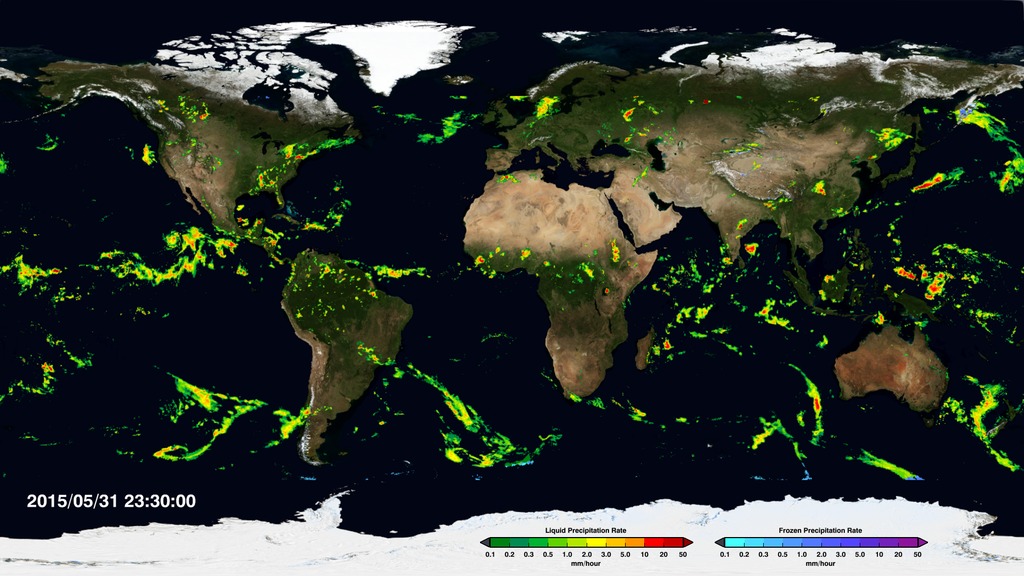
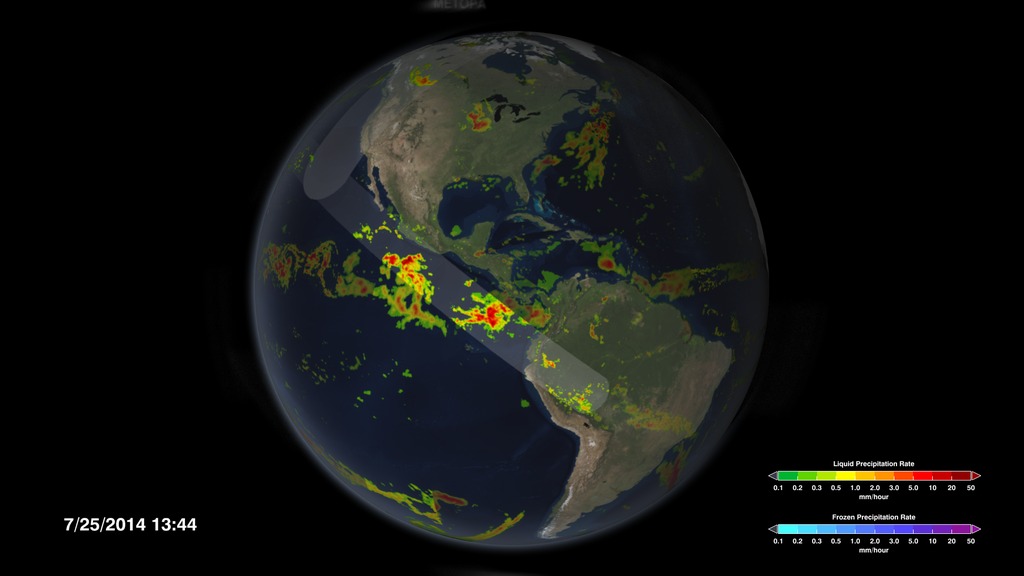
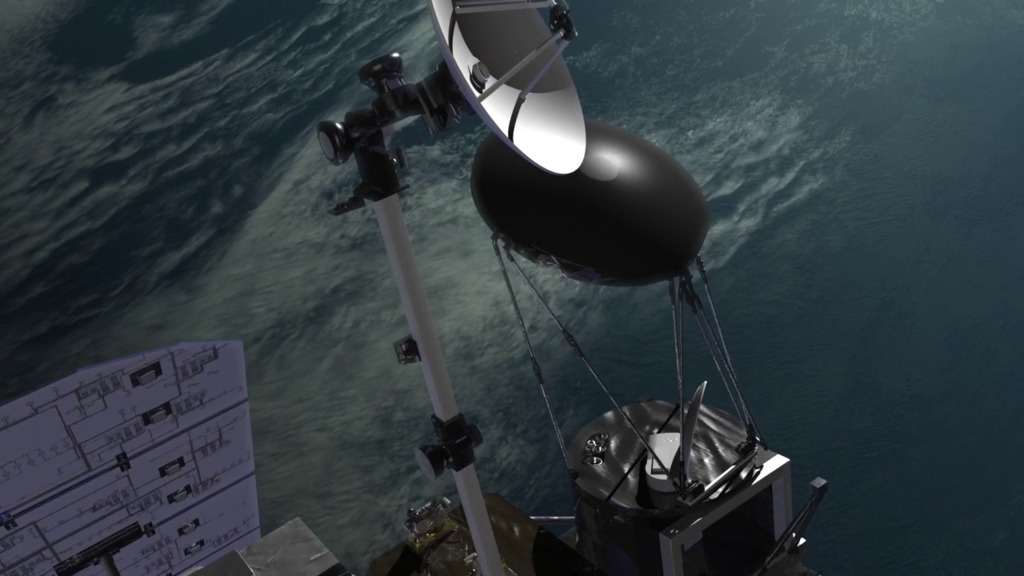
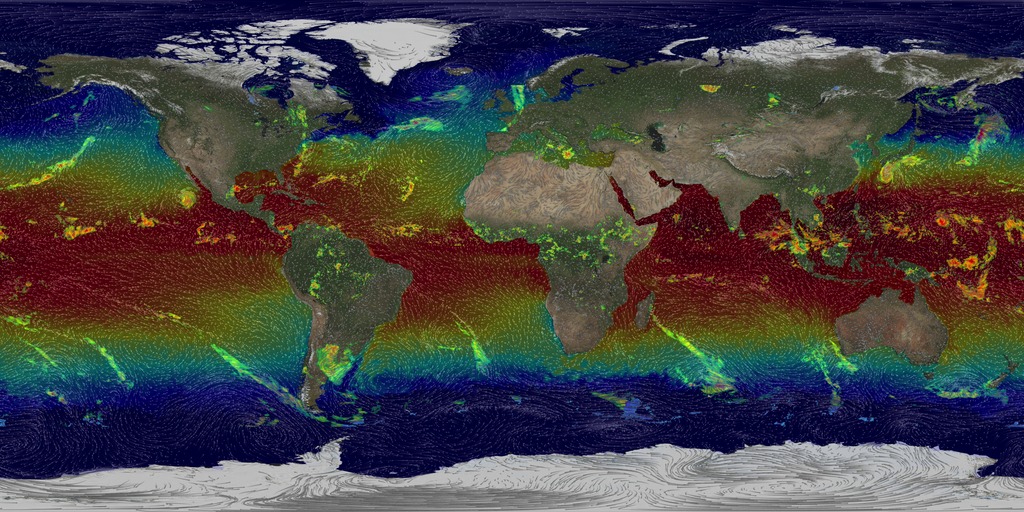
The ten currently-flying satellites in the Global Precipitation Measurement Constellation provide unprecedented information about the rain and snow across the entire Earth. This visualization shows the constellation in action, taking precipitation measurements underneath the satellite orbits. As time progresses and the Earth's surface is covered with measurements, the structure of the Earth's preciptation becomes clearer, from the constant rainfall patterns along the Equator to the storm fronts in the mid-latitudes. The dynamic nature of the precipitation is revealed as time speeds up and the satellite data swaths merge into a continuous visualization of changing rain and snowfall. Finally, the video fades into an visualization of IMERG, the newly available data set of global precipitation every thirty minutes that is derived from this satellite data.
This is a newer version of the animation and uses a modified version of the Liquid Precipitation Rate colorbar. This newer colorbar improves the display of higher rain rates.
.")
The colorbar for liquid precipitation (rain).
The colorbar for frozen precipitation (snow).
Credits
Please give credit for this item to:
NASA's Scientific Visualization Studio
-
Data visualizers
- Horace Mitchell (NASA/GSFC)
-
Alex Kekesi
(Global Science and Technology, Inc.)

-
Scientists
-
George Huffman
(NASA/GSFC)
- Gail Skofronick Jackson (NASA/GSFC)
- Dalia B Kirschbaum (NASA/GSFC)
-
George Huffman
(NASA/GSFC)
-
Producer
- Ryan Fitzgibbons (USRA)
Missions
This page is related to the following missions:Series
This page can be found in the following series:Datasets used
-
Daily Rainfall [TRMM: TMI]
ID: 520This dataset can be found at: http://disc.sci.gsfc.nasa.gov/data/datapool/TRMM/01_Data_Products/index.html
See all pages that use this dataset -
Rain Rates (Surface Precipitation) [GPM: GMI]
ID: 822Credit: Data provided by the joint NASA/JAXA GPM mission.
See all pages that use this dataset -
IMERG
ID: 863This dataset can be found at: http://pmm.nasa.gov/sites/default/files/document_files/IMERG_ATBD_V4.4.pdf
See all pages that use this dataset
Note: While we identify the data sets used on this page, we do not store any further details, nor the data sets themselves on our site.
Related
- ID: 12185
 Produced Video
 - ID: 12182
 Produced Video
 - ID: 4382
 Visualization
 - ID: 4372
 Visualization
 - ID: 4283
 Visualization
 - ID: 11392
 Produced Video
Used as a Source In
- ID: 12897
- ID: 12126
Release date
This page was originally published on Thursday, October 1, 2015.
This page was last updated on Sunday, February 2, 2025 at 12:07 AM EST.