A newer version of this visualization is available.
Arctic Sea Ice Maximum - 2015
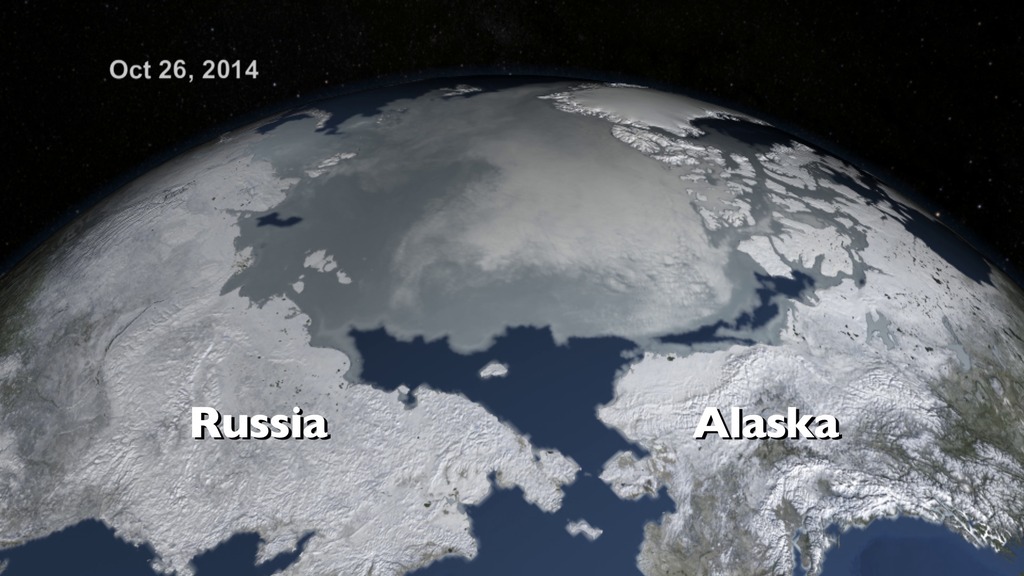
An animation of the Arctic sea ice from October 1, 2014 to February 25, 2015 when the ice reached its maximum annual extent. The 2015 maximum is then compared to the average 1979-2014 maximum shown in yellow. A distance indicator shows the difference between the two in the Sea of Okhotsk north of Japan.
The maximum Arctic sea ice extent appears to have occurred on February 25, 2015, reaching an extent of 14.52 million square kilometers (5.61 million square miles). If the February 25 value holds, it would be one of the earliest maximums on record, 15 days earlier than normal, and the lowest extent in the satellite record starting in 1979. It is 129,500 square kilometers (50,000 square miles) below the previous lowest maximum recorded in 2011. Overall, there is a declining trend in the maximum extent of about 2.5 % per decade. This is much smaller than the summer trends, but also reflects the long-term warming trend in the Arctic.
While a low maximum gives the extent a head start heading into summer, it turns out that there is very little relation between the maximum and summer minimum and a record low maximum does not portend a record low minimum. This is because the ice near the edge at the time of the maximum is thin, seasonal ice that will melt out early in the summer. The weather conditions in the Arctic during the summer melt season is the most crucial in determining whether a record low is possible in any given year.
The same animation as above without the date and text labels.

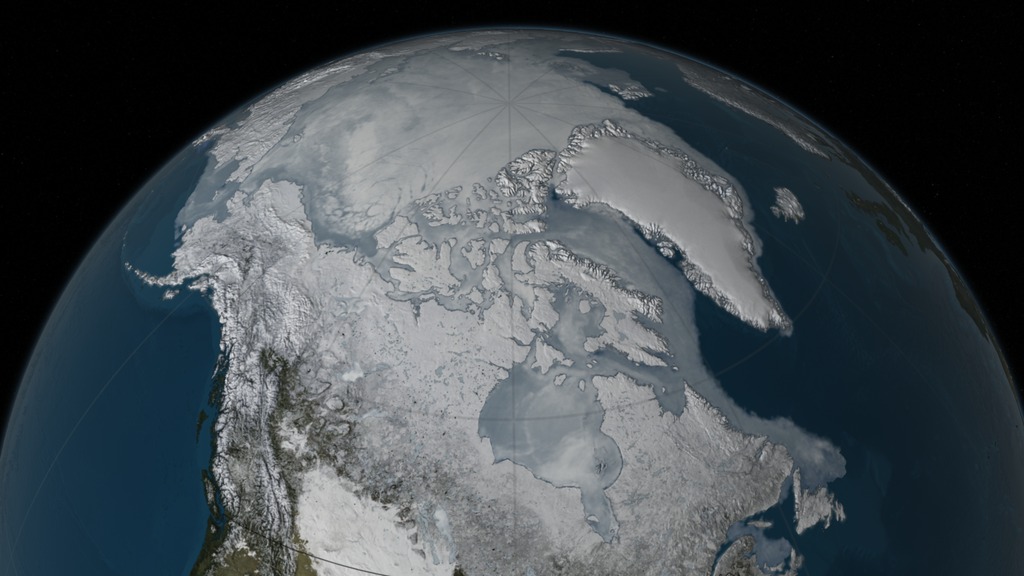
An image of the Arctic sea ice on February 25, 2015 shown over the 1979-2014 average maximum sea ice concentration, shown here in yellow.
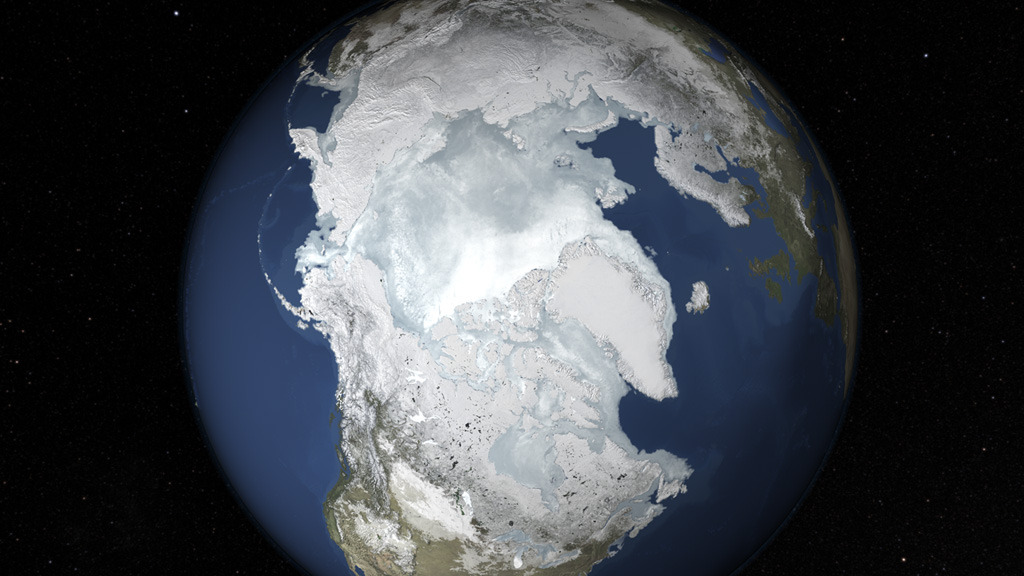
An image of the 2015 Arctic maximum sea ice on February 25, 2015.
An image of the Arctic sea ice on February 25, 2015 when the ice reached its maximum annual extent. The 2015 maximum is compared to the 1979-2014 average maximum shown in yellow. A distance indicator shows the difference between the two in the Sea of Okhotsk north of Japan.
An image of the Arctic sea ice on February 25, 2015 shown over the 1979-2014 average maximum sea ice concentration, shown here in yellow.
An image of the 2015 Arctic maximum sea ice on February 25, 2015.
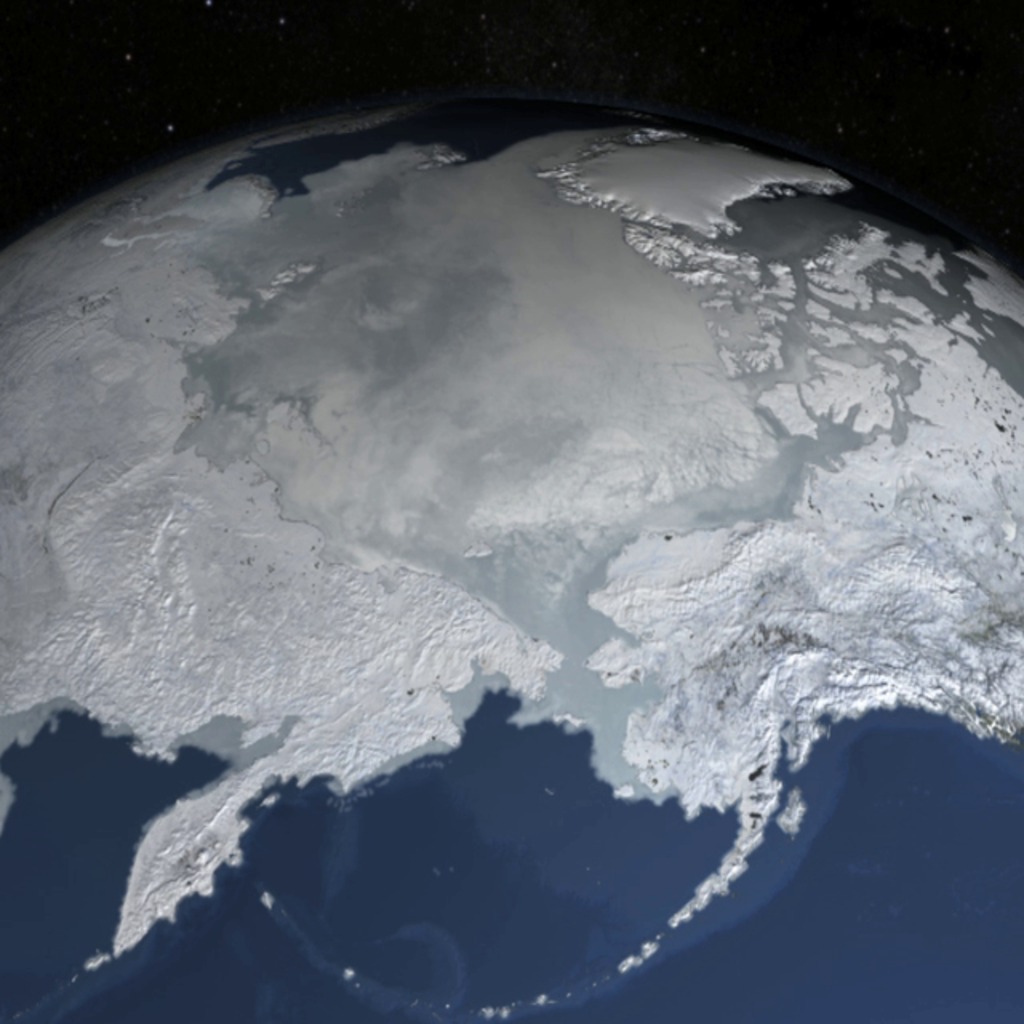
An image viewed from the north of the Arctic sea ice on February 25, 2015 shown over the 1979-2014 average maximum sea ice concentration, displayed here in yellow.
An image viewed from the north of the 2015 Arctic maximum sea ice on February 25, 2015.
The text overlay with transparency
Credits
Please give credit for this item to:
NASA's Scientific Visualization Studio
-
Visualizer
-
Cindy Starr
(Global Science and Technology, Inc.)

-
Cindy Starr
(Global Science and Technology, Inc.)
-
Producers
- Jefferson Beck (USRA)
- Joy Ng (USRA)
-
Scientists
- Josefino Comiso (NASA/GSFC)
- Walt Meier (NASA/GSFC)
-
Sr. data analyst
- Robert Gersten (Wyle Information Systems)
Datasets used
-
BMNG (Blue Marble: Next Generation) [Terra and Aqua: MODIS]
ID: 508Credit: The Blue Marble data is courtesy of Reto Stockli (NASA/GSFC).
This dataset can be found at: http://earthobservatory.nasa.gov/Newsroom/BlueMarble/
See all pages that use this dataset -
10 km Daily Sea Ice Concentration [SHIZUKU (GCOM-W1): AMSR2]
ID: 795Credit: AMSR2 data courtesy of the Japan Aerospace Exploration Agency (JAXA).
See all pages that use this dataset -
10 km Daily 89 GHz Brightness Temperature [SHIZUKU (GCOM-W1): AMSR2]
ID: 796Credit: AMSR2 data courtesy of the Japan Aerospace Exploration Agency (JAXA).
See all pages that use this dataset -
Average Maximum Arctic Sea Ice Concentration Above 15% [DMSP: SSM/I]
ID: 871
Note: While we identify the data sets used on this page, we do not store any further details, nor the data sets themselves on our site.
Related
- ID: 11837
 Produced Video
 - ID: 11815
- ID: 11814
Newer Versions
- ID: 4440
 Visualization
Release date
This page was originally published on Thursday, March 19, 2015.
This page was last updated on Wednesday, May 3, 2023 at 1:49 PM EDT.