The Winter of 2013 – 2014: A Cold, Snowy and Icy Winter in North America
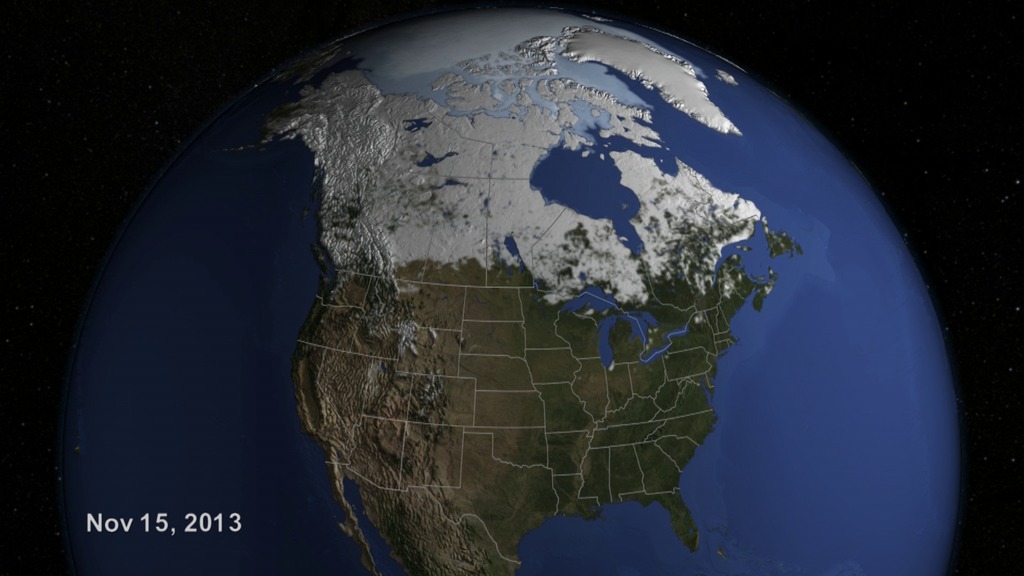
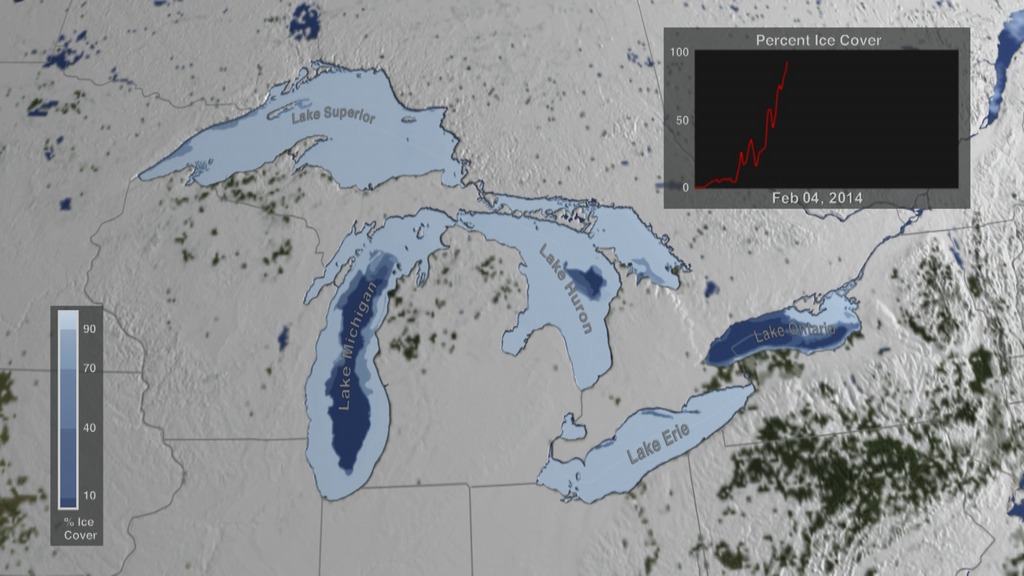
This animation shows the snow cover over North America during the 2013-2014 winter as well as the ice concentration over the Great Lakes. The date and a graph showing the percent of ice cover over the Great Lakes and Lake Superior is shown on this version.
The well-known Polar Vortex, frigid air originating in the Arctic, was pushed southward in the 2013 – 2014 winter by a high-pressure system in the Pacific, contributing to a cold, snowy and icy winter in North America.
By early December, snow blanketed the mountains in the western United States and by January and February snow and unusually cold weather, with some record-breaking low temperatures and snowfall amounts, had reached parts of Canada and the eastern United States. New York City, Philadelphia, and Chicago all had one of their ten snowiest winters, while Detroit had its snowiest winter on record.
Ice formed early in the 2013 – 2014 winter, and stayed late on the Great Lakes. The maximum ice extent, 92.5 %, occurred on March 6th. This is the second most extensive ice cover observed over the Great Lakes during the satellite era (the record was 94.7% in 1979). Four of the Great Lakes (Superior, Michigan, Huron and Erie) became 90% or more ice covered for the first time since 1994. Lake Michigan reached 93.3% ice cover on March 8, 2014, setting a new record. The ice season persisted until the official ice-off date of June 6th. The extensive and thick ice cover on the Great Lakes in 2014 caused significant difficulties for shipping throughout the season.
Lake Superior reached its maximum ice extent on March 5th at 95.7%.The United States Coast Guard icebreaker, USCGC Mackinaw, attempts to establish a shipping lane and escort three lake freighters from the Duluth area to the locks at Sault Ste. Marie. Although the locks opened for the shipping season on March 25th, owing to the severe ice conditions the first freighter did not transit the locks until April 4th. Part of the ship track of the Mackinaw is shown in the animation (from March 21st to March 24th 2014). Some views of the extensive ice cover, having a thickness up to 42 inches in eastern Lake Superior, are reminiscent of sea ice in polar oceans.
This animation shows the snow cover over North America during the 2013-2014 winter as well as the ice concentration over the Great Lakes. No date or graph is shown on this version.

An image of the snow over North America on February 13, 2014.
An image of ice concentration on the Great Lakes on March 23, 2014.
An image of the track of the United States Coast Guard icebreaker, USCGC Mackinaw, as it attempts to establish a shipping lane from March 21-24, 2014.
The date, colorbar and graph overlay with transparency
Color scale for the lake ice percent
Credits
Please give credit for this item to:
NASA's Scientific Visualization Studio.
Special thanks to the U.S. Coast Guard for icebreaker and helicopter support.
-
Scientists
- Dorothy Hall (NASA/GSFC)
- George Leshkevich (NOAA)
- Son Nghiem (NASA/JPL CalTech)
-
Visualizer
-
Cindy Starr
(Global Science and Technology, Inc.)

-
Cindy Starr
(Global Science and Technology, Inc.)
-
Technical support
- Laurence Schuler (ADNET Systems, Inc.)
- Ian Jones (ADNET Systems, Inc.)
-
Video editor
-
Cindy Starr
(Global Science and Technology, Inc.)
-
Cindy Starr
(Global Science and Technology, Inc.)
Missions
This page is related to the following missions:Datasets used
-
Snow Cover Daily L3 Global 0.05Deg CMG (MOD10C1) [Terra: MODIS]
ID: 504 -
BMNG (Blue Marble: Next Generation) [Terra and Aqua: MODIS]
ID: 508Credit: The Blue Marble data is courtesy of Reto Stockli (NASA/GSFC).
This dataset can be found at: http://earthobservatory.nasa.gov/Newsroom/BlueMarble/
See all pages that use this dataset -
10 km Daily Sea Ice Concentration [SHIZUKU (GCOM-W1): AMSR2]
ID: 795Credit: AMSR2 data courtesy of the Japan Aerospace Exploration Agency (JAXA).
See all pages that use this dataset -
10 km Daily 89 GHz Brightness Temperature [SHIZUKU (GCOM-W1): AMSR2]
ID: 796Credit: AMSR2 data courtesy of the Japan Aerospace Exploration Agency (JAXA).
See all pages that use this dataset -
Great Lakes Daily Ice Concentration
ID: 867This dataset can be found at: http://www.natice.noaa.gov/products/great_lakes.html
See all pages that use this dataset
Note: While we identify the data sets used on this page, we do not store any further details, nor the data sets themselves on our site.
Related
- ID: 11824
- ID: 11823
Release date
This page was originally published on Monday, March 16, 2015.
This page was last updated on Sunday, February 2, 2025 at 10:19 PM EST.