Life Histories from Landsat: 25 Years in the Pacific Northwest Forest
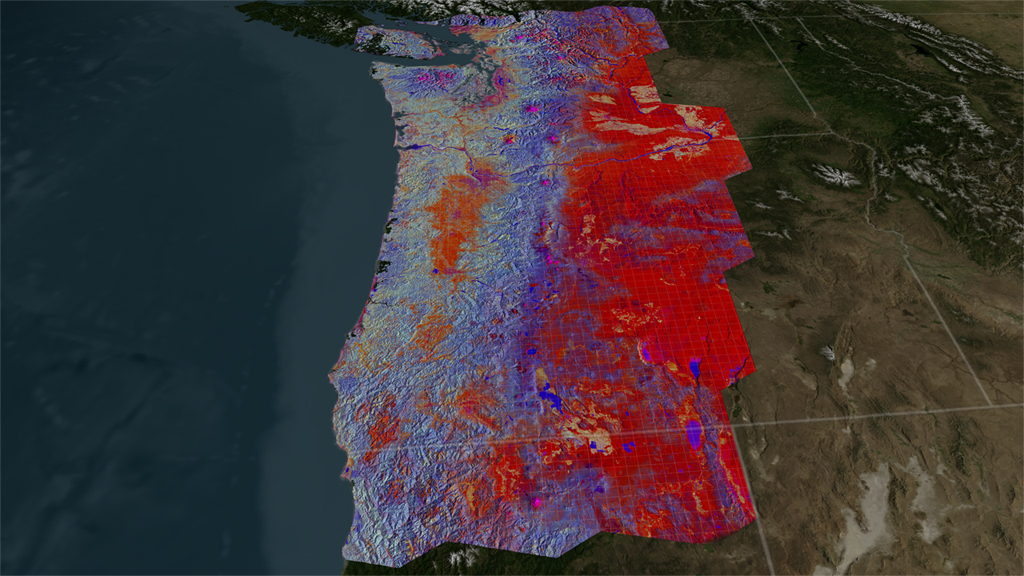
This visualization shows a sequence of Landsat-based data in the Pacific Northwest. There is one data set for each year representing an aggregate of the approximate peak of the growing season (around August). The data was created using a sophisticated algorithm called LandTrendr. LandTrendr analyzes 'stacks' of Landsat scenes, looking for statistical trends in the data and filtering out noise. The algorithm evaluated data from more than 1,800 Landsat Thematic Mapper images, nearly 1 Terabyte of raw imagery, to define the life histories of each of more than 336 million pixels on the landscape. The resulting trends identify periods of stability and change that are displayed as colors.
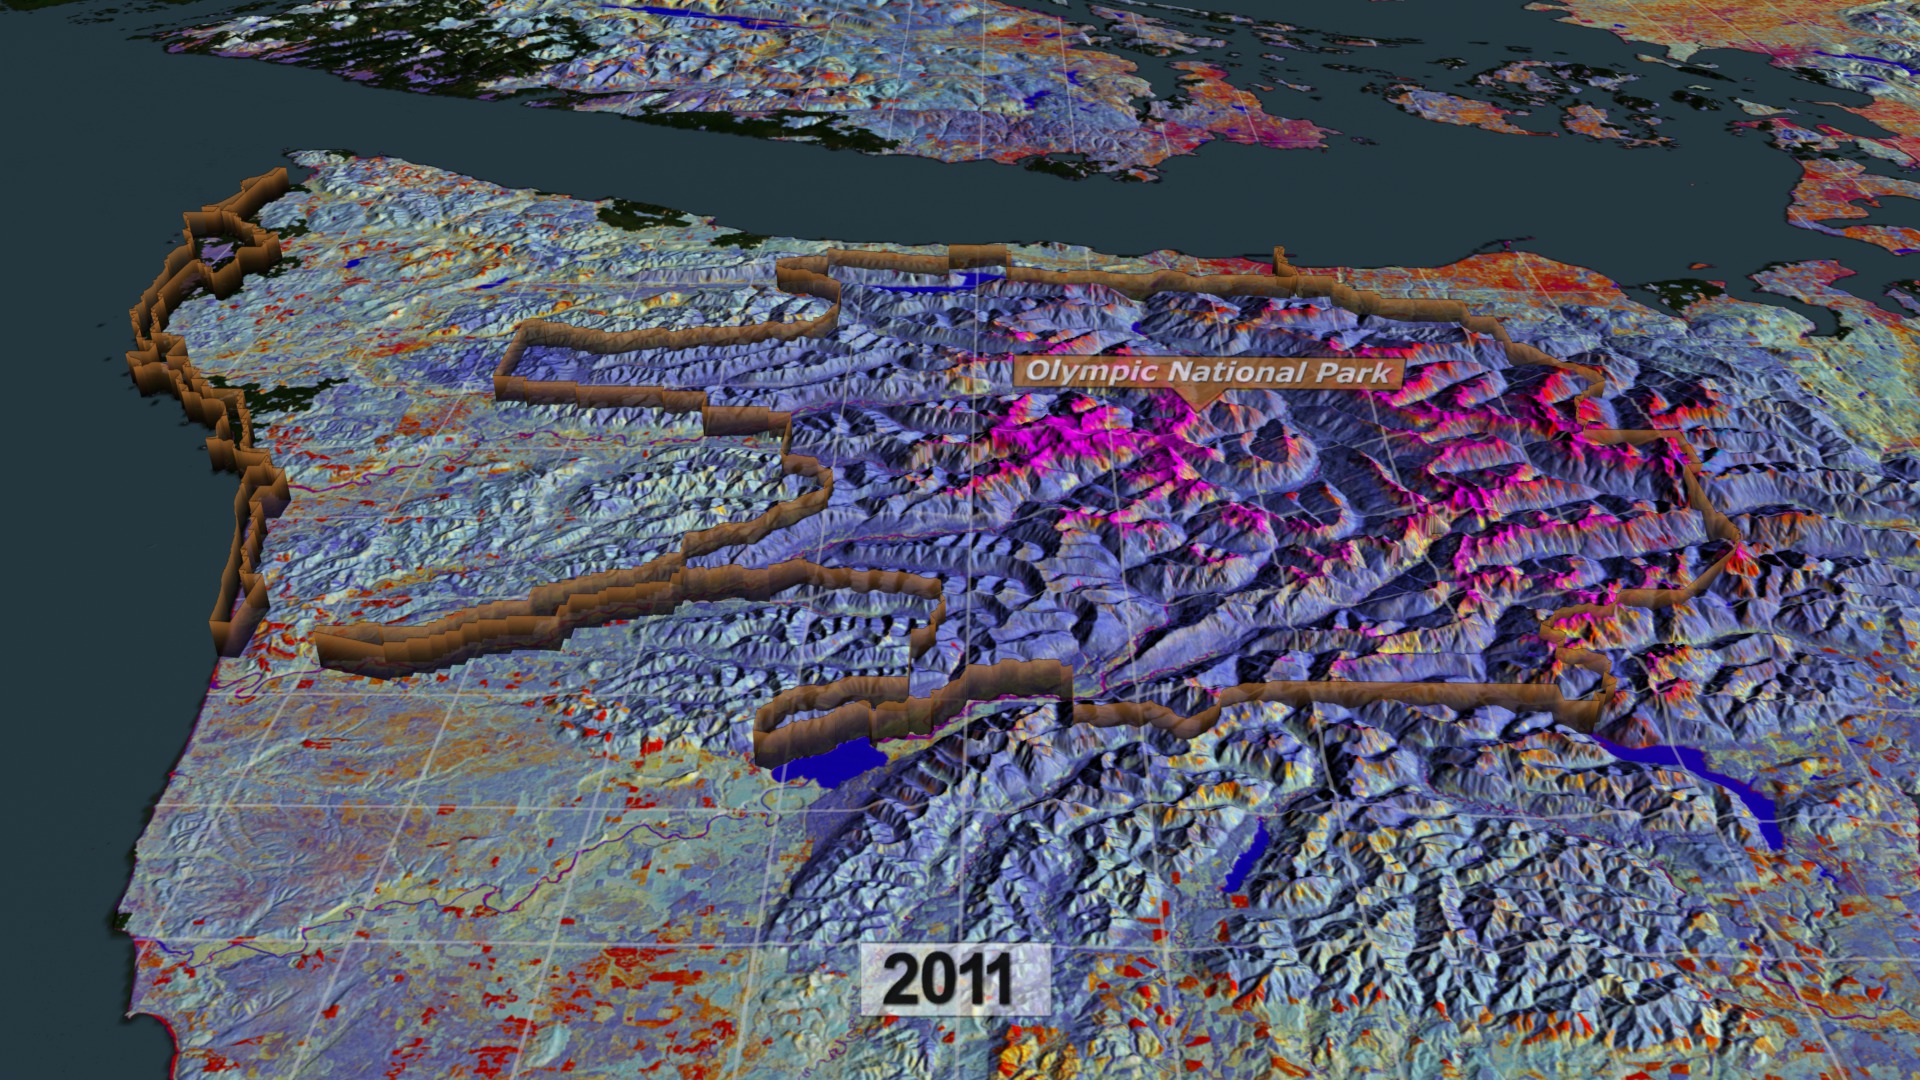
In these false color images, the colors represent types of land; for example, blue areas are forests; orange/yellow areas are agriculture; and, purple areas are urban. Each 'stack' is representative of a Landsat scene. There are 22 stacks stitched together to cover most of the U.S. Pacific Northwest. This processed data is used for science, natural resource management, and education.
The visualization zooms into the Portland area showing different types of land such as agricultural, urban, and forests. We move south to a region that was evergreen forest for a number of years (blue), then was clear cut in 1999 (orange), then began to regrow (yellow). A graph shows the trajectories for a particular location in the clearcut as the years repeat. The dots represent the original data from Landsat; and, the line represents LandTrendr analysis. We move over to the Three Sisters region to show an area of pine forest that becomes infested with bark beetles in 2004. Next, we move to the southern foothills of Mount Hood where a budworm infestation is in progress; around 1991, the worms move on to another area and shrubs start to regrow. Next we
move to the east side of Mount Rainier National Park to see another budworm outbreak followed by shrub regrowth. Finally, we move to the west of Mount Rainier where we can see widespread clear cutting outside of the park, but no clear cutting inside the protected park land.
Don't miss this related tour of the region.
Narrated video of LandTrendr analysis of the Pacific Northwest, using data from Robert Kennedy (Boston University) using Landsat satellites. Visualized by Greg Shirah of NASA Goddard Scientific Visualization Studio.
For complete transcript, click here.
This video is also available on our YouTube channel.
LandTrendr analysis of the Pacific Northwest. No audio.
LandTrendr analysis of the Pacific Northwest. No audio and no graphs.

Frames for 5x3 or 3x3 hyperwall
Print resolution still over Portland
Print resolution still showing shrub regrowth after a clear cut
Print resolution still showing a bark beetle infestation near the Three Sisters
Print resolution still showing shrub regorwth after a budworm infestation near Mount Hood
Print resolution still showing shrub regrowth after a budworm infestation east of Mount Rainier
Print resolution still comparing clear cutting on private land versus protected park land
Print resolution still showing the exent of the data set used in these visualizations covering about 2/3 of Washington and Oregon
Print resolution still of North America with LandTrendr data
Print resolution still of North America without LandTrendr data
Color legend
Credits
Please give credit for this item to:
NASA's Goddard Space Flight Center Scientific Visualization Studio and the Laboratory for Applications of Remote Sensing in Ecology at Oregon State University
-
Animators
-
Greg Shirah
(NASA/GSFC)

-
Alex Kekesi
(Global Science and Technology, Inc.)
- Horace Mitchell (NASA/GSFC)
-
Greg Shirah
(NASA/GSFC)
-
Producer
- Matthew R. Radcliff (USRA)
-
Scientists
- Robert Kennedy (Boston University)
- Zhiqiang Yang (Oregon State University)
- Justin Braaten (Oregon State University)
-
Writer
- Ellen T. Gray (ADNET Systems, Inc.)
Missions
This page is related to the following missions:Series
This page can be found in the following series:Datasets used
-
[Landsat]
ID: 47 -
DEM [SRTM: SIR-C]
ID: 481 -
BMNG (Blue Marble: Next Generation) [Terra and Aqua: MODIS]
ID: 508Credit: The Blue Marble data is courtesy of Reto Stockli (NASA/GSFC).
This dataset can be found at: http://earthobservatory.nasa.gov/Newsroom/BlueMarble/
See all pages that use this dataset -
LandTrendr
ID: 764The Landsat satellites have witnessed decades of change on the Earth's surface. Algorithms in LandTrendr
This dataset can be found at: http://landtrendr.forestry.oregonstate.edu
See all pages that use this dataset
Note: While we identify the data sets used on this page, we do not store any further details, nor the data sets themselves on our site.
Related
- ID: 11144
 Produced Video
 - ID: 4012
Release date
This page was originally published on Friday, December 7, 2012.
This page was last updated on Sunday, December 15, 2024 at 12:03 AM EST.