Landsat Data Continuity Mission (LDCM) Orbits
The Landsat Data Continuity Mission (LDCM), also to be named Landsat 8 after its scheduled launch in February 2013, will be the eighth in the series of Landsat satellites. Since 1972, Landsat satellites have been observing and measuring Earth's continental and coastal landscapes at 15 to 30 meter resolution, where human impacts and natural changes can be monitored and characterized over time.
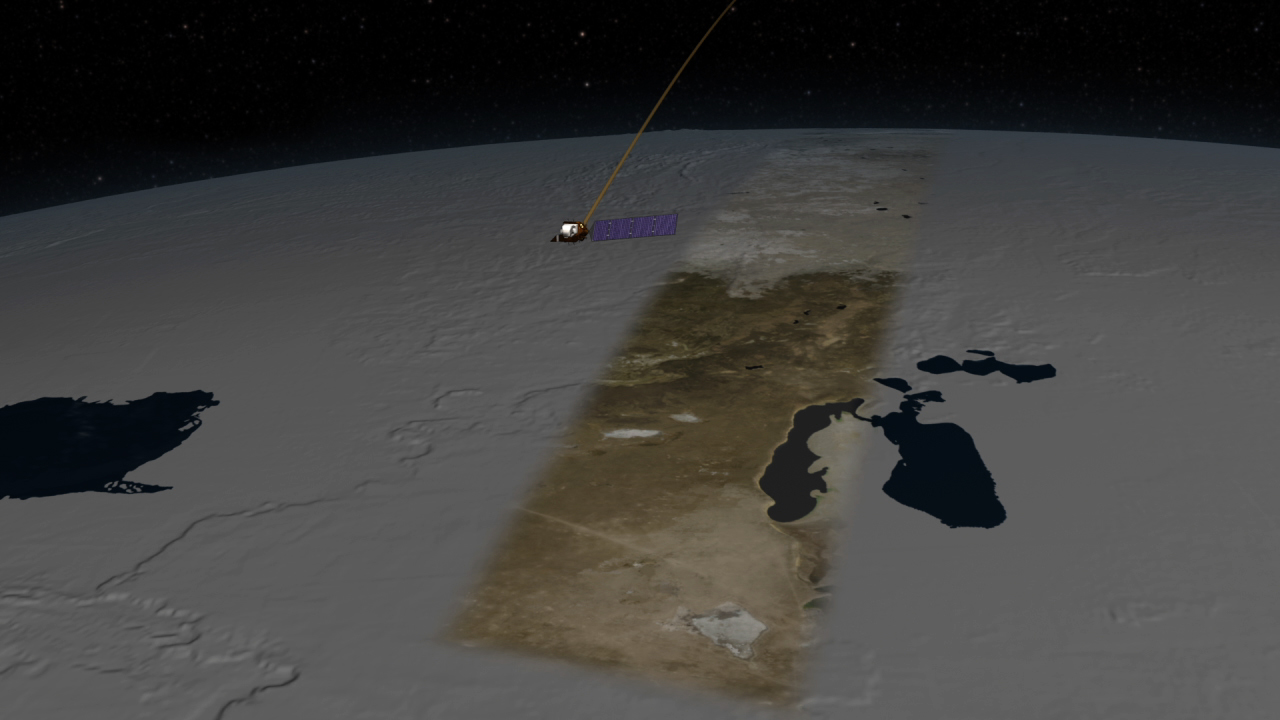
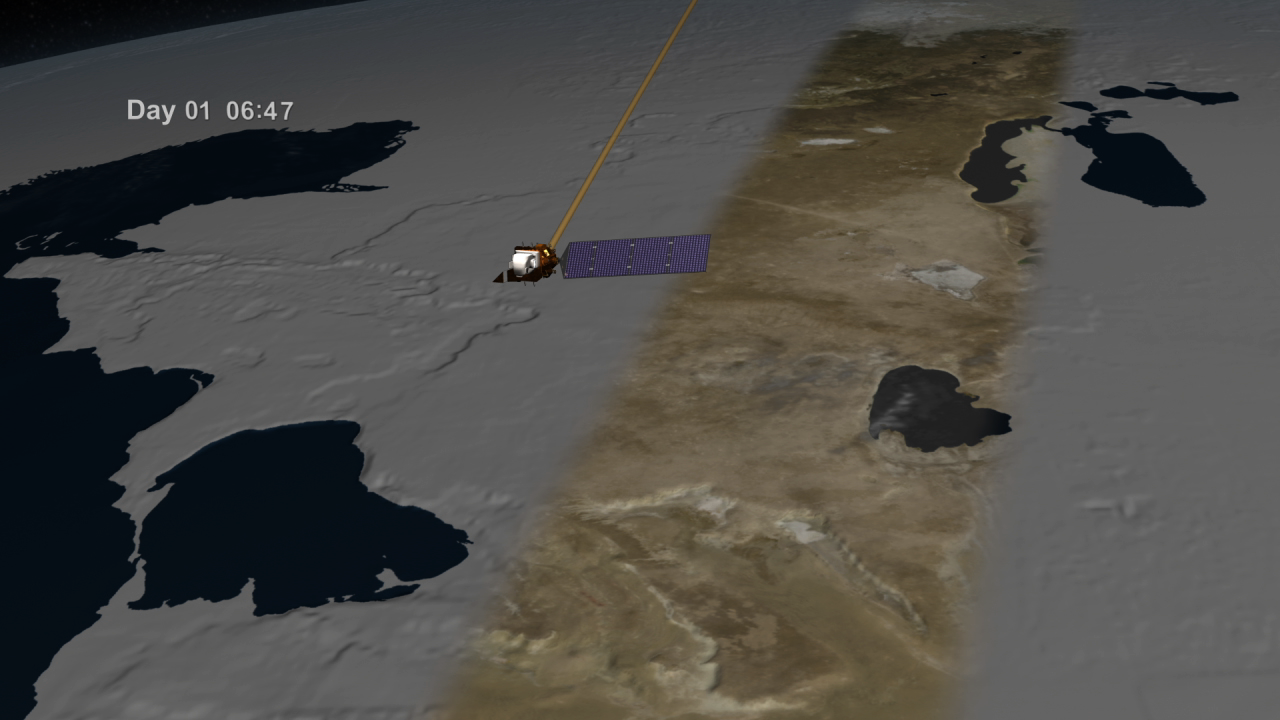
This animation portrays how the LDCM satellite will orbit the Earth 13 times per day at an altitude of 705 km collecting landcover data. With a cross-track width of 185 km, the satellite will completely cover the globe in a 16 day period compiling a total of 233 orbits. A day number and the elapsed time are shown to clearly depict the passage of time which starts slowly in the beginning and increases to day-by-day steps at the end of the animation. The terrain is exaggerated by 6 times during the first day portrayed, but is increased to 12 times when the camera pulls out to a global view. An artificial orbit trail is shown following the spacecraft to indicate its position when the satellite itself is too small to be visible.
The composite animation of the Landsat Data Continuity Mission (LDCM) satellite orbiting the Earth, with the satellite, Earth, stars and day/time overlay.
This video is also available on our YouTube channel.
The composite animation with the satellite, Earth and stars.
The Earth and satellite layer with transparency.
The background star field
The day/time overlay with transparency

A still image of the LDCM satellite and the ground swath.
Frame set designed for a 5x3 hyperwall.
Credits
Please give credit for this item to:
NASA/Goddard Space Flight Center Scientific Visualization Studio
The Blue Marble data is courtesy of Reto Stockli (NASA/GSFC).
-
Visualizer
-
Cindy Starr
(Global Science and Technology, Inc.)

-
Cindy Starr
(Global Science and Technology, Inc.)
-
Animators
-
Greg Shirah
(NASA/GSFC)
-
Ernie Wright
(USRA)
- Walt Feimer (HTSI)
- Rachel Kreutzinger (USRA)
-
Greg Shirah
(NASA/GSFC)
-
Producer
- Matthew R. Radcliff (USRA)
-
Scientist
- James R. Irons (NASA/GSFC)
Missions
This page is related to the following missions:Datasets used
-
GTOPO30 Topography and Bathymetry
ID: 274 -
BMNG (Blue Marble: Next Generation) [Terra and Aqua: MODIS]
ID: 508Credit: The Blue Marble data is courtesy of Reto Stockli (NASA/GSFC).
This dataset can be found at: http://earthobservatory.nasa.gov/Newsroom/BlueMarble/
See all pages that use this dataset -
Blue Marble Cloud Cover [Terra and Aqua: MODIS]
ID: 509Credit: The Blue Marble data is courtesy of Reto Stockli (NASA/GSFC).
See all pages that use this dataset -
GLAS/ICESat 1 km Laser Altimetry Digital Elevation Model of Greenland [ICESat: GLAS]
ID: 723
Note: While we identify the data sets used on this page, we do not store any further details, nor the data sets themselves on our site.
Related
- ID: 11475
 Produced Video
 - ID: 11481
 Produced Video
Used as a Source In
- ID: 14410
 Produced Video
 - ID: 13979
![Music: Futurity by Lee Groves [PRS] and Peter George Marett [PRS]Complete transcript available.](/vis/a010000/a013900/a013979/Screen_Shot_2021-10-28_at_2.29.18_PM.png)
- ID: 13889
![Landsat 9, launching September 2021, will collect the highest quality data ever recorded by a Landsat satellite, while still ensuring that these new measurements can be compared to those taken by previous generations of the Earth-observing satellite. Landsat 9 will enable or improve measurements of water quality, glacial ice velocity, crop water usage, and much more.Music: The Waiting Room by Sam Dodson [PRS], Afterglow by Christopher Timothy White [PRS], both published by Atmosphere Music Ltd [PRS]; and Inner Strength by Brava/Dsilence/Input/Output [SGAE], published by El Murmullo Sarao [SGAE] and Universal Sarao [SGAE]. Available from Universal Production Music. Complete transcript available.Watch this video on the NASA Goddard YouTube channel.](/vis/a010000/a013800/a013889/13889_Landsat9_at_Work_print.png) Produced Video
Produced Video - ID: 13247
![Video promoting the technological advances of Landsat 9, continuing the legacy of global land imaging begun in 1972. The video highlights the origin of the Landsat program and some of the many benefits we receive from its data.Music: Marble Place by Matias Suescun [SACEM], published by KTSA Publishing [SACEM], available from Universal Production Music Complete transcript available.Watch this video on the NASA Goddard YouTube channel.](/vis/a010000/a013200/a013247/Landsat9_teaser_20200723_youtube.00142_print.jpg) Produced Video
Produced Video
Release date
This page was originally published on Monday, April 16, 2012.
This page was last updated on Wednesday, October 9, 2024 at 12:02 AM EDT.