A newer version of this visualization is available.
Multi-year Arctic Sea Ice
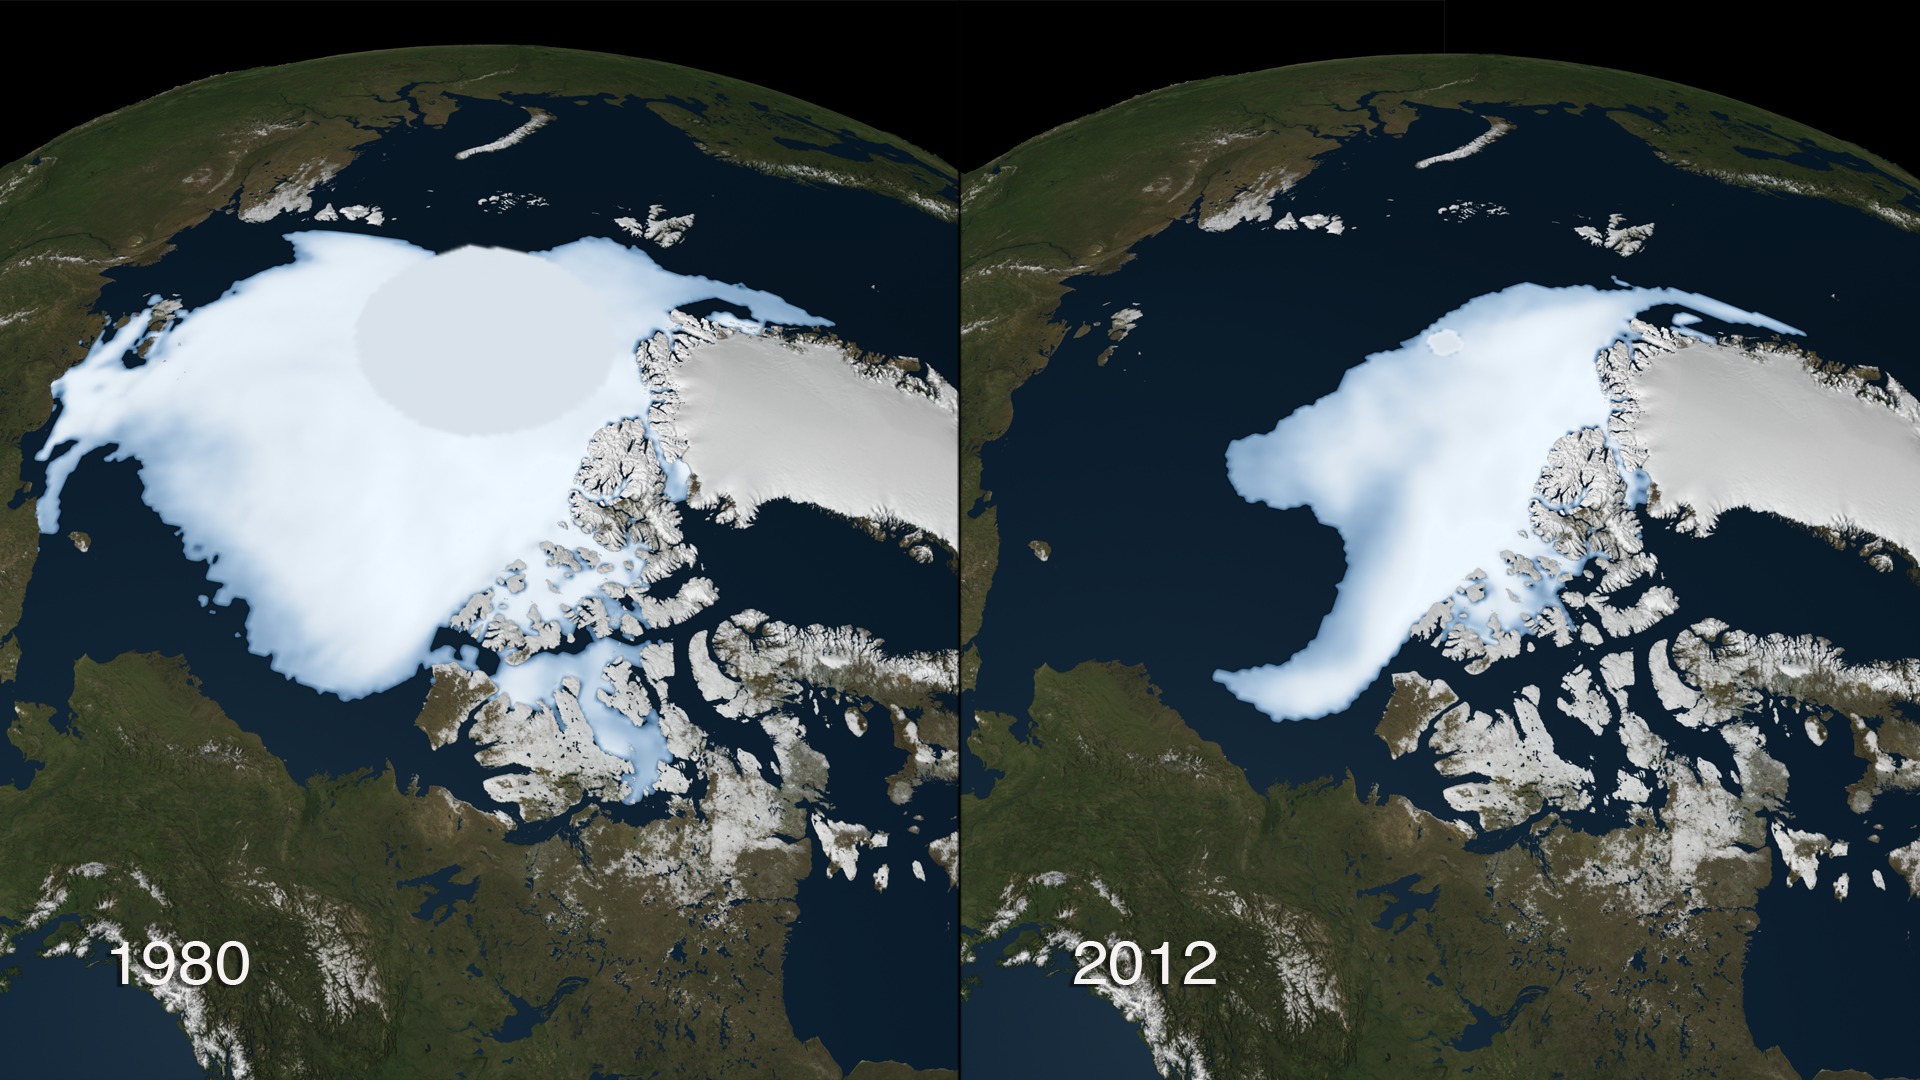
The most visible change in the Arctic region in recent years has been the rapid decline of the perennial ice cover. The perennial ice is the portion of the sea ice floating on the surface of the ocean that survives the summer. This ice that spans multiple years represents the thickest component of the sea ice cover.
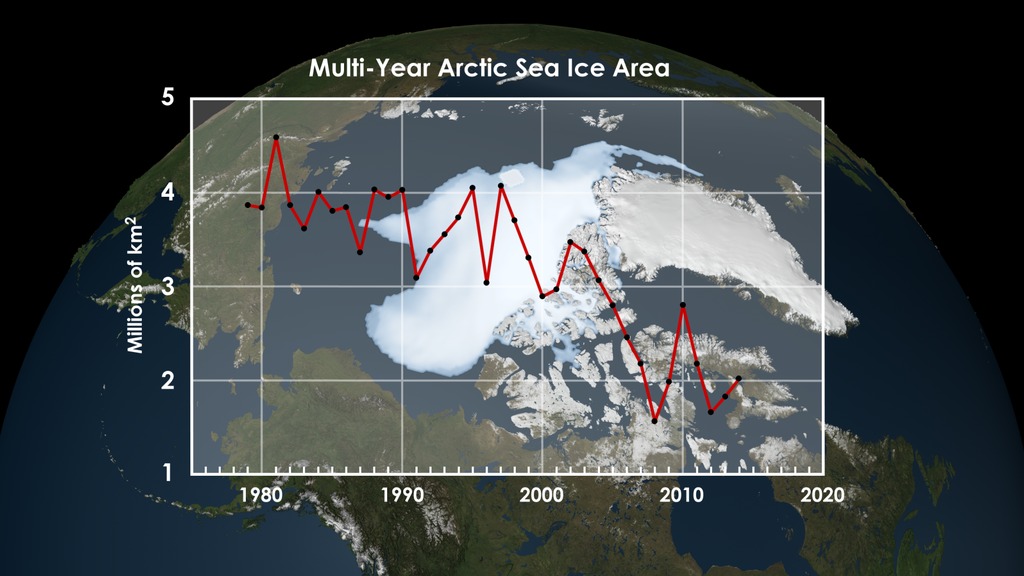
This visualization shows the perennial Arctic sea ice from 1980 to 2012. This is not the sea ice minimum, which occurs in September each year. This measures the perennial sea ice that survives the summer and thus exists for longer than a one-year time span. The measurement for this sea ice was taken during the months of November, December and January each year. The date assigned to the data point is the year of the last measurement (January). The grey disk at the North Pole indicates the region where no satellite data is collected. A graph overlay shows the area's size measured in million square kilometers for each year. The '1980','2008', and '2012' data points are highlighted on the graph.
Multi-year Arctic Sea Ice with Graph Overlay
Multi-year Arctic Sea Ice with Date Overlay
Multi-year Sea Ice (without Graph or Date Overlay)

This image shows the multiyear sea ice in 2012. The grey disk at the North Pole indicates the region where no satellite data was collected.
This image shows the multiyear sea ice in 1980. The grey disk at the North Pole indicates the region where no satellite data was collected.
The graph overlay with transparency
The date overlay with transparency
Credits
Please give credit for this item to:
NASA/Goddard Space Flight Center Scientific Visualization Studio
-
Visualizer
-
Cindy Starr
(Global Science and Technology, Inc.)

-
Cindy Starr
(Global Science and Technology, Inc.)
-
Animators
- Lori Perkins (NASA/GSFC)
-
Greg Shirah
(NASA/GSFC)
-
Video editor
- Stuart A. Snodgrass (Global Science and Technology, Inc.)
-
Producer
- Jefferson Beck (USRA)
-
Scientist
- Josefino Comiso (NASA/GSFC)
-
Project support
- James W. Williams (Global Science and Technology, Inc.)
-
Writer
- Maria-Jose Vinas Garcia (Telophase)
Datasets used
-
Comiso's Multi-year Sea Ice Concentration [DMSP: SSM/I]
ID: 728
Note: While we identify the data sets used on this page, we do not store any further details, nor the data sets themselves on our site.
Related
- ID: 10919
 Produced Video
Newer Versions
- ID: 4251
 Visualization
Release date
This page was originally published on Friday, February 24, 2012.
This page was last updated on Wednesday, May 3, 2023 at 1:53 PM EDT.