A newer version of this visualization is available.
Hyperwall Show: Earth Observing Fleet with Suomi NPP and Aquarius
A newer version of this visualization can be found here.
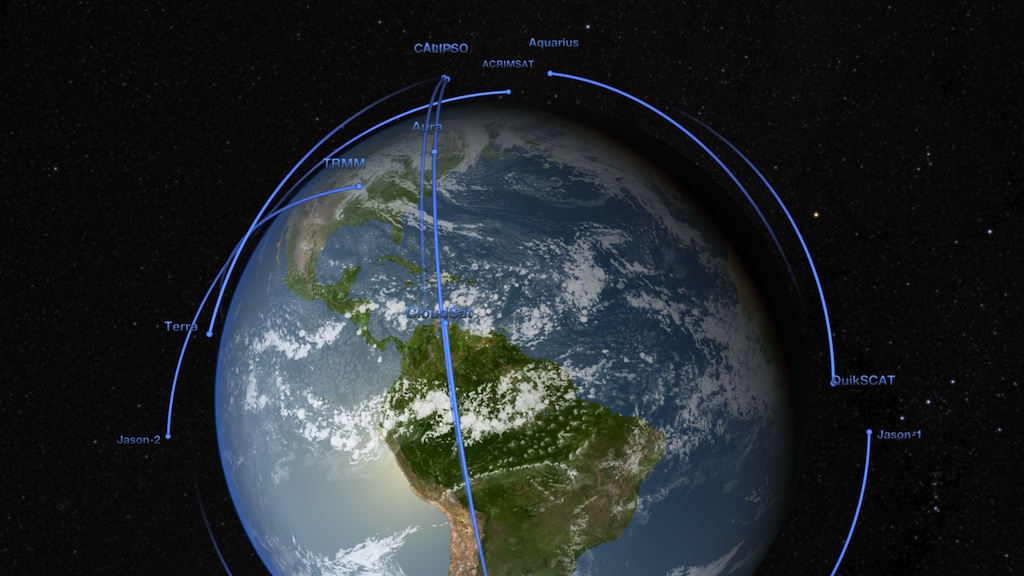
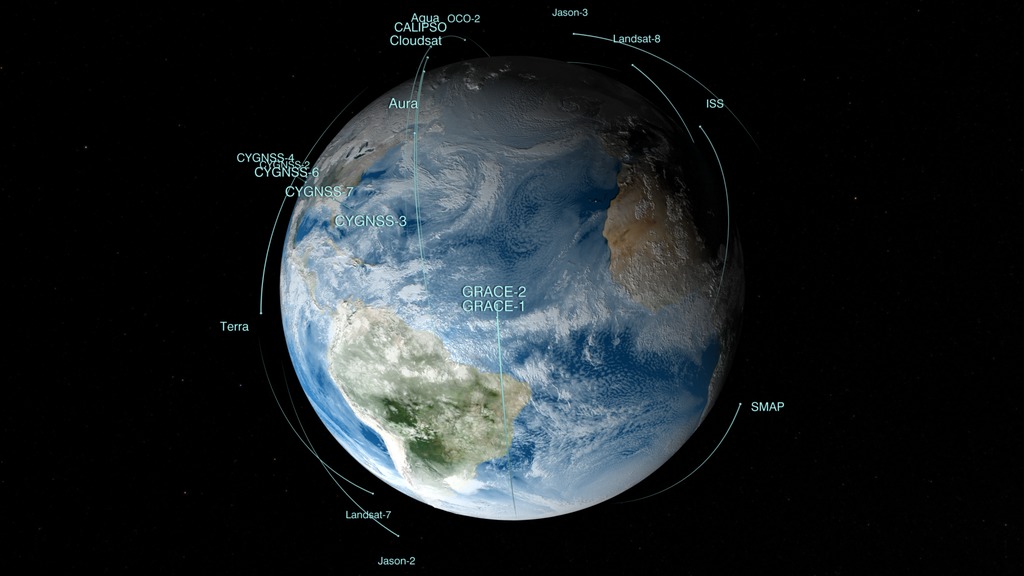
This animation shows the orbits of NASA's current (as of November 2011) fleet of Earth remote sensing observatories. The satellites include components of the A-Train (Terra, Aqua, Aura, CloudSat, CALIPSO), two satellites launched in 2011 (Aquarius, Suomi NPP), and nine others (ACRIMSAT, SORCE, GRACE, Jason 1 and 2, Landsat 7, QuikSCAT, TRMM, and EO-1). These satellites measure tropical rainfall, solar irradiance, clouds, sea surface height, ocean salinity, and other aspects of the global environment. Together, they provide a picture of the Earth as a system.
This is an update of entry 3725. It was created for display on the NASA Center for Climate Simulation (NCCS) hyperwall, a 5 x 3 array of high-definition displays with a total pixel resolution of 6840 x 2304. The orbits are based on orbital elements with epochs in November of 2011. The animation spans six hours, from 15:00 to 21:00 UT (10 am to 4 pm EST) on November 30, 2011.
Movie files encoded at reduced resolutions suitable for playback on single displays.
.")
Hyperwall frames. The names of the screens that comprise the hyperwall follow the spreadsheet convention in which rows are assigned numbers, beginning with 1 at the top, and columns are assigned letters, beginning with A at the left. The display in the upper left is A1. The display in the bottom right is E3 (for a 5 x 3 display).
Credits
Please give credit for this item to:
NASA/Goddard Space Flight Center Scientific Visualization Studio
-
Animators
-
Ernie Wright
(USRA)

-
Greg Shirah
(NASA/GSFC)
- Tom Bridgman (Global Science and Technology, Inc.)
-
Ernie Wright
(USRA)
Datasets used
-
BMNG (Blue Marble: Next Generation) [Terra and Aqua: MODIS]
ID: 508Credit: The Blue Marble data is courtesy of Reto Stockli (NASA/GSFC).
This dataset can be found at: http://earthobservatory.nasa.gov/Newsroom/BlueMarble/
See all pages that use this dataset -
GEOS-5 Cubed-Sphere (GEOS-5 Atmospheric Model on the Cubed-Sphere)
ID: 663The model is the GEOS-5 atmospheric model on the cubed-sphere, run at 14-km global resolution for 30-days. GEOS-5 is described here http://gmao.gsfc.nasa.gov/systems/geos5/ and the cubed-sphere work is described here http://sivo.gsfc.nasa.gov/cubedsphere_overview.html.
See all pages that use this dataset
Note: While we identify the data sets used on this page, we do not store any further details, nor the data sets themselves on our site.
Related
- ID: 10980
 Produced Video
Newer Versions
- ID: 4558
 Visualization
Release date
This page was originally published on Tuesday, December 6, 2011.
This page was last updated on Sunday, February 2, 2025 at 10:04 PM EST.