GEOS-5 Nature Run
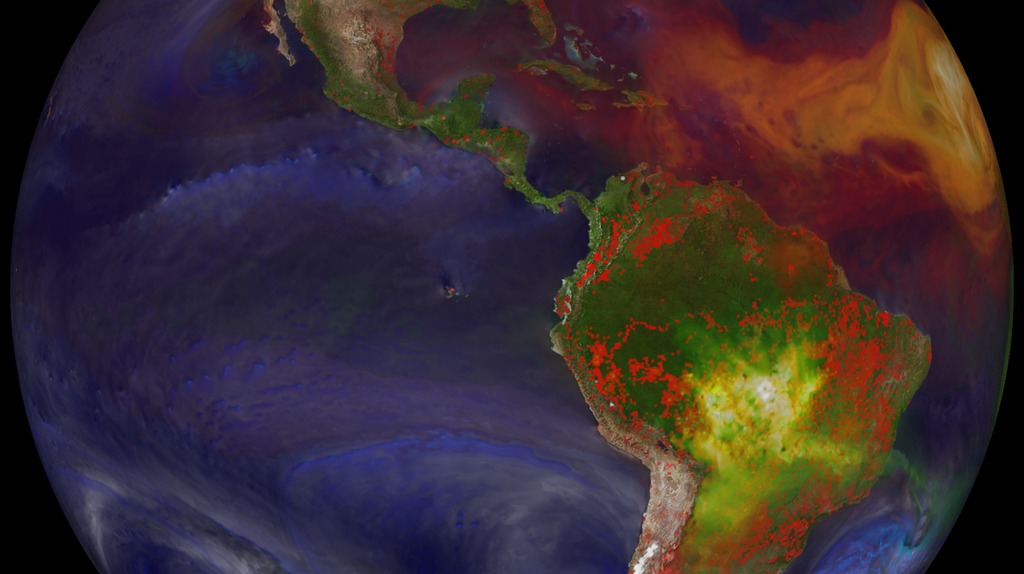
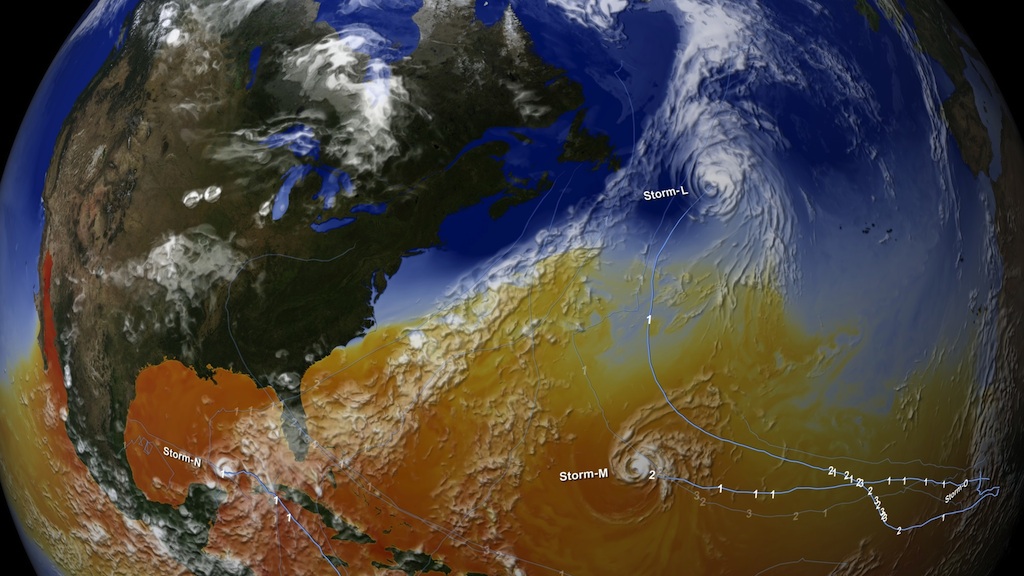
This visualization shows a Goddard Earth Observing System Model, Version 5 (GEOS-5) run of the 2005 Hurricane Season driven by Sea Surface Temperatures (SST). The simulation was seeded at the beginning of the run and then ran on its own to create the 6 months of output visualized here. What's interesting is that even though the model did not perfectly duplicate all 27 storms from that very active 2005 hurricane season, it does show 23 storms during that same period. Considering this was an anomalous year, the model did a good job of simulating the large number of storms for that season. An innovative aspect of this global model is the ability to represent realistic hurricane intensities, including 6 hurricanes in the Atlantic for 2005 reaching major strength (category 3 or higher on the Saffir-Simpson scale). This finding could help shape future climate models in predicting hurricane season intensities.
Ocean colors ranging from blue to orange depict air temperatures 2 meters (T2M) above sea level. Since SSTs are typically measured at sea level and below, the T2M model output behaves somewhat differently. Nonetheless, it is a reasonable proxy to SST. Landcover information is taken from the Next Generation Blue Marble dataset. Sea Ice is depicted as solid white and clouds are shades of white.
1080p version of the Nature Run hyperwall show. Since hyperwall resolutions are usually much higher than HDTV, hurricane labels and tracks have been enlarged for better viewing on HDTV screens.

2 meter temperature above sea level colorbar. Temperature units in Celsius.
The original frames used for the 3x3 hyperwall show. Note: Any of these frames should be useable as print resolution stills.

The large animation above is diced-up into smaller tiles that can be played on the hyperwall. Each tile is named according to a standard spreadsheet convention with a1 at the upper left and c3 at the lower right. This image illustrates this naming convention used in the diced-up frame sets below.
Upper left screen of the 3x3 Nature Run hyperwall show (A1). Primarily showing the West/Northwest portion of North America.
Left of center screen of the 3x3 Nature Run hyperwall show (A2). Primarily showing Southern portion of North America and Northern Mexico.
Lower left screen of the 3x3 Nature Run hyperwall show (A3). Primarily showing Southern Mexico and Central America.
Upper middle screen for the 3x3 Nature Run hyperwall show (B1). Shows the Northeastern tip of North America.
Center screen for the 3x3 Nature Run hyperwall show (B2). Shows most of North America's east coast.
Lower center screen for the 3x3 Nature Run show (B3). Shows most of most of Cuba and the Caribbean islands.
Upper right screen of the 3x3 Nature Run hyperwall show (C1). Shows Europe at the limb of the Earth.
Right of center screen of the 3x3 Nature Run hyperwall show (C2). Shows the nortern part of the West African coast.
Lower right screen of the 3x3 Nature Run hyperwall show (C3). Primarily shows the South Atlantic.
NASA's Goddard's Phil Webster shows how supercomputing Earth's climate is done at the NASA booth at the American Geophysical Union (AGU) meeting in San Francisco. (Photo taken 12/6/11.)
Credits
Please give credit for this item to:
NASA/Goddard Space Flight Center Scientific Visualization Studio
-
Animators
-
Alex Kekesi
(Global Science and Technology, Inc.)

-
Greg Shirah
(NASA/GSFC)
-
Alex Kekesi
(Global Science and Technology, Inc.)
-
Scientist
- William Putman (NASA/GSFC)
Related papers
Datasets used
-
GEOS Atmospheric Model
ID: 665
Note: While we identify the data sets used on this page, we do not store any further details, nor the data sets themselves on our site.
Related
- ID: 30017
 Hyperwall Visual
 - ID: 11016
 Produced Video
Release date
This page was originally published on Tuesday, December 6, 2011.
This page was last updated on Sunday, December 15, 2024 at 12:01 AM EST.