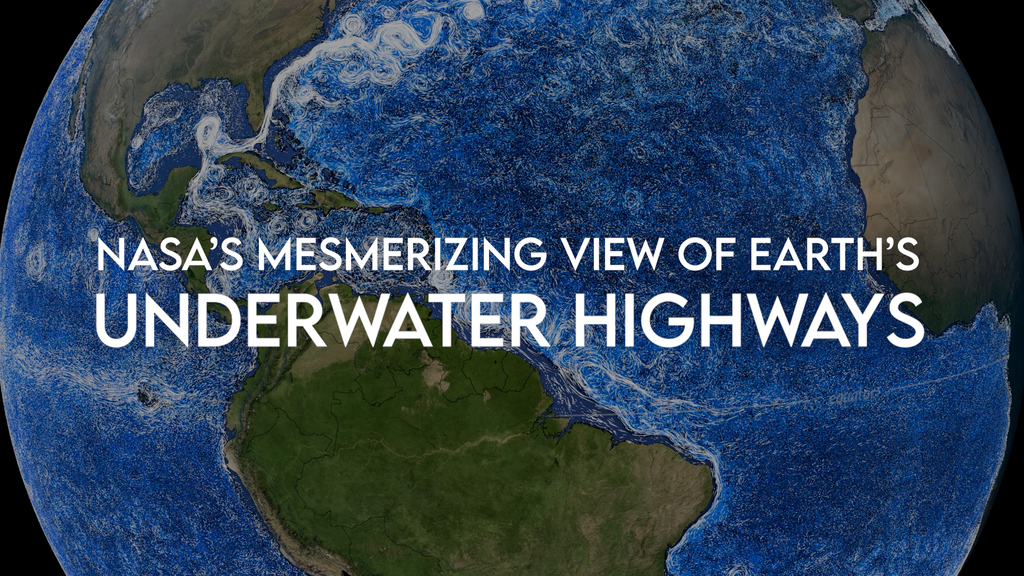
Perpetual Ocean
This visualization shows ocean surface currents around the world during the period from June 2005 through December 2007. The visualization does not include a narration or annotations; the goal was to use ocean flow data to create a simple, visceral experience.
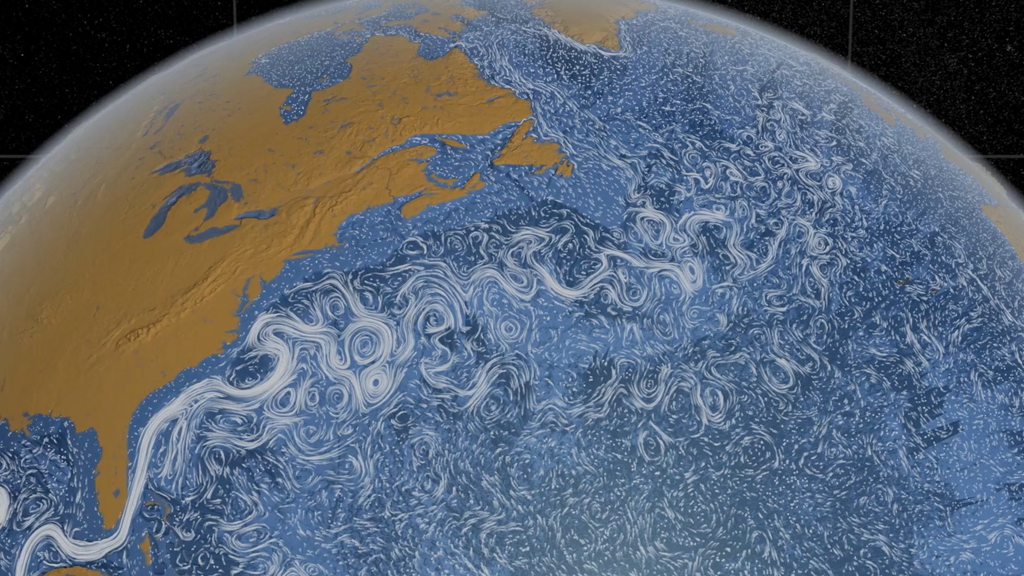
This visualization was produced using model output from the joint MIT/JPL project: Estimating the Circulation and Climate of the Ocean, Phase II or ECCO2. ECCO2 uses the MIT general circulation model (MITgcm) to synthesize satellite and in-situ data of the global ocean and sea-ice at resolutions that begin to resolve ocean eddies and other narrow current systems, which transport heat and carbon in the oceans. ECCO2 provides ocean flows at all depths, but only surface flows are used in this visualization. The dark patterns under the ocean represent the undersea bathymetry. Topographic land exaggeration is 20x and bathymetric exaggeration is 40x.
This visualization was shown at the SIGGRAPH Asia 2012 Computer Animation Festival.
Don't miss these related visualizations:
Gulf Stream Sea Surface Currents and Temperatures
Ocean Current Flows around the Mediterranean Sea for UNESCO
Global Sea Surface Currents and Temperature
Flat Map Ocean Current Flows with Sea Surface Temperatures (SST)
Perpetual Ocean is a visualization of some of the world's surface ocean currents.

Print resolution still of Gulf Stream
Print resolution still of currents near Southern Africa
Print resolution still of the Kuroshio Current
Twenty minute version of ocean flows at 30 frames per second. This version does not include the 'speed ups', labels, narration, or soundtrack from Perpetual Ocean.
For More Information
Credits
Please give credit for this item to:
NASA/Goddard Space Flight Center Scientific Visualization Studio
-
Animators
-
Greg Shirah
(NASA/GSFC)

- Horace Mitchell (NASA/GSFC)
-
Greg Shirah
(NASA/GSFC)
-
Video editor
- Victoria Weeks (HTSI)
-
Scientists
- Hong Zhang (UCLA)
- Dimitris Menemenlis (NASA/JPL CalTech)
Missions
This page is related to the following missions:Series
This page can be found in the following series:Datasets used
-
GTOPO30 Topography and Bathymetry
ID: 274 -
Tycho Catalogue (Tycho 2 Catalogue) [Hipparcos: Telescope]
ID: 550This dataset can be found at: http://archive.eso.org/ASTROM/
See all pages that use this dataset -
ECCO2 (ECCO2 High Resolution Ocean and Sea Ice Model)
ID: 707
Note: While we identify the data sets used on this page, we do not store any further details, nor the data sets themselves on our site.
Related
- ID: 14745
- ID: 10841
 Produced Video
Used as a Source In
- ID: 14043
 Produced Video
Release date
This page was originally published on Monday, August 15, 2011.
This page was last updated on Sunday, March 16, 2025 at 10:02 PM EDT.