Black Carbon: Asia's Plain Of Air Pollution
The Himalayan Plateau, a towering mass of rock on the northern edge of the Indian subcontinent, rises sharply over one of the most fertile and populous tracts of land in the world, the Indo-Gangetic Plain. Nearly a billion people crowd that plain, an area about the size of Texas. The region's explosive population growth and strong economy in recent decades have produced an unwelcome byproduct—air pollution. Burning fossil fuels, wood, vegetation and dung sends a steady stream of soot (or, black carbon, as scientists call the light-absorbing particles) aloft. Studies show India's black carbon emissions have jumped about 60 percent per decade in the last two decades. The short-lived particles typically remain in the atmosphere for less than a week, but they pool over the Indo-Gangetic plain as monsoon-fueled winds trap them along the Himalayas. The particles, the most health-sapping part of air pollution, also have a potent climate impact. Unlike most other types of particulate, black carbon absorbs radiation, warming the atmosphere and contributing to the retreat of glaciers in the area. The visualization below, based on three months of data generated by NASA's GOCART model, shows black carbon circulating throughout the region, held largely at bay by the mountain range.

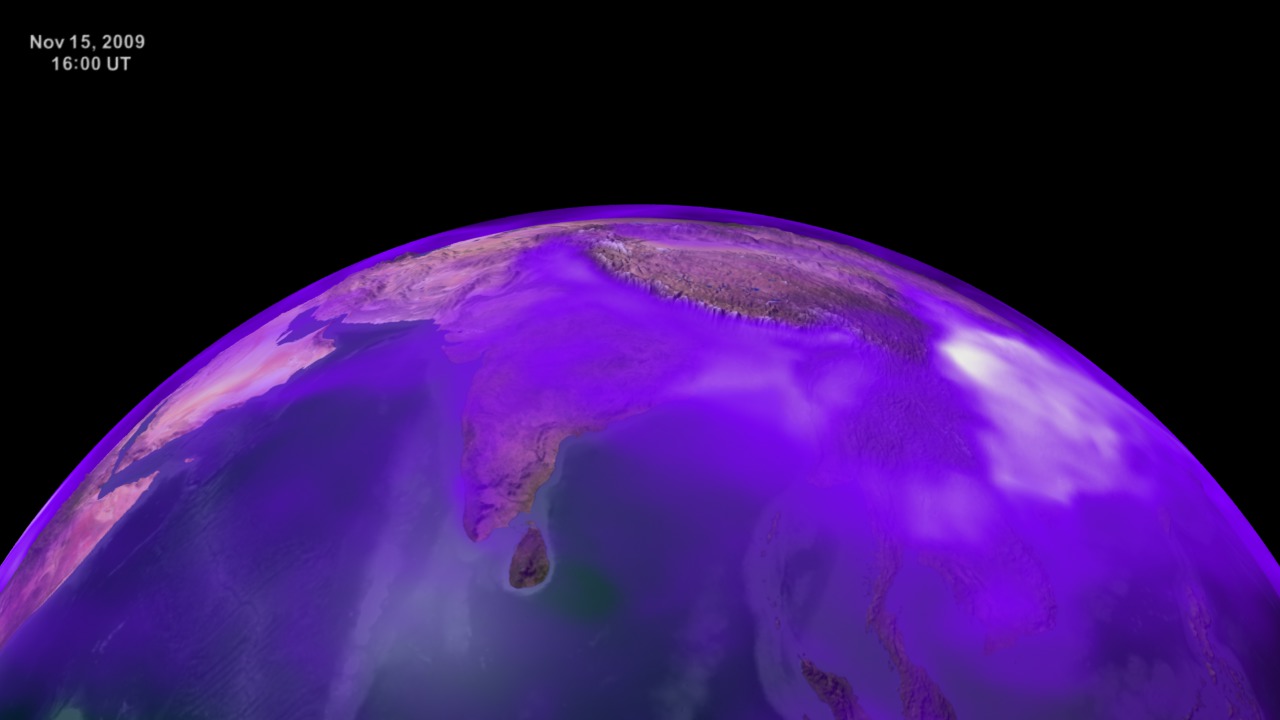
A region's brawny economy leaves a pall of black carbon over the Indo-Gangetic plain.
Plumes of black carbon swirl over the Indo-Gangetic plain, but farther to the east more heavily polluted air dances over China.
A snapshot from the model highlights what a strong barrier to airflow the Himalayas represent.
A NASA satellite image provides a true-color look at the same phenomenon. The mountains keep haze fenced in to the southwest.
Visualizations can't do it all. Here, scientists trek into the Himalayas to collect ice cores that contain soot layers dating back to the 1950s.
Dark layers, comprised mainly of black carbon and dust, are clearly visible as a scientist explores a crevasse on Mera glacier in Nepal.
For More Information
See NASA.gov
Credits
Please give credit for this item to:
NASA's Goddard Space Flight Center
Image of Researchers Hiking on Ice Sheet courtesy of the Institute of Tibetan Plateau Research, Chinese Academy of Sciences
Image of Researcher Rappelling Down Crevasse courtesy of Jesse Cunningham, http://www.jessecunningham.com
-
Animators
-
Greg Shirah
(NASA/GSFC)

- Horace Mitchell (NASA/GSFC)
-
Greg Shirah
(NASA/GSFC)
-
Producer
- Maria Frostic (UMBC)
-
Scientist
- William K. Lau (NASA/GSFC)
-
Writer
- Adam P Voiland (Wyle Information Systems)
Related
- ID: 11015
 Produced Video
 - ID: 3665
 Visualization
Release date
This page was originally published on Thursday, August 11, 2011.
This page was last updated on Wednesday, May 3, 2023 at 1:53 PM EDT.