NCCS Hyperwall Show: GEOS-5 Modeled Clouds at 5-km Resolution (Flat Map)
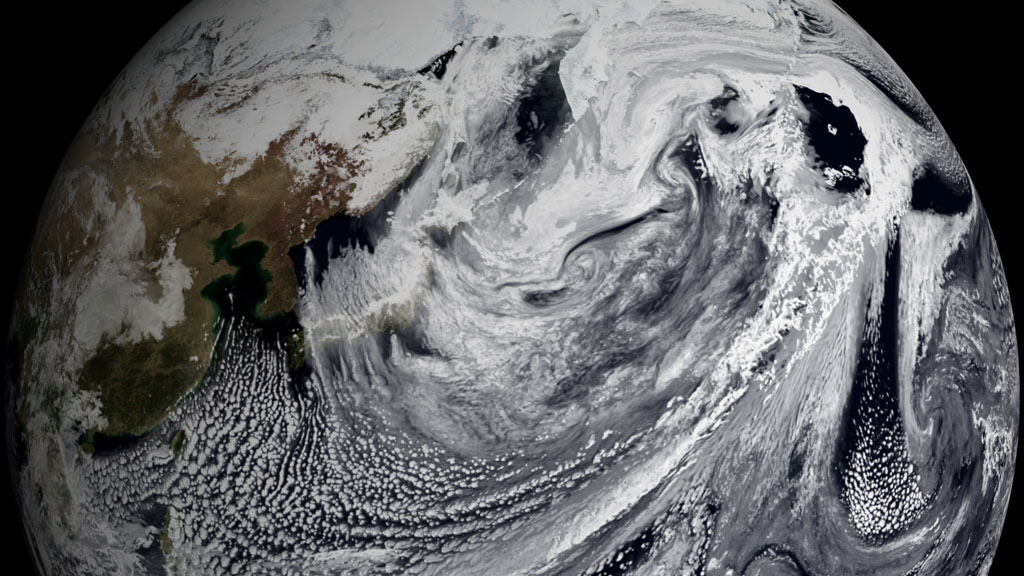
This visualization shows clouds from a simulation using the Goddard Earth Observing System Model, Verison 5 (GEOS5). The global atmospheric simulation ran at a resolution of 5-km per grid cell and covered a period from Feb 2, 2010 through Feb 22, 2010. The results of the simulation were written out at 30 minute intervals. This is a high-resolution non-hydrostatic global model.
This visualization was created for display on the NASA Center for Climate Simulation (NCCS) hyperwall. This is a set of tiled high definition displays consisting of 5 displays across by 3 displays down. The full resolution of all combined displays is 6840 pixels accross by 2304 pixels down. This movie was rendered at this high resolution, then diced up into images to be displayed on each screen.
A similar, lower resolution visualization is available in entry #3724. The lower resolution version is for comparison to current operational model resolution output. When displaying these visualizations on the hyperwall, we sometimes show them in a checkerboard pattern with alternating 5-km and quarter-degree tiles for easy comparison. We chose to stretch the image to fit the hyperwall aspect rather than cropping or adding black bars.
Full image of GEOS-5 Modeled Clouds
Cropped version of GEOS-5 modeled clouds showing most of North America. Two major 2010 East coast snow storms can be seen in this animation.

The large animation above is diced-up into smaller pieces that can be played on the hyperwall. Each piece is named according to a standard spreadsheet convention with a1 at the upper left and e3 at the lower right. This image illustrates this naming convention used in the diced-up frame sets below.
Display a1 of GEOS-5 modeled clouds
Display a2 of GEOS-5 modeled clouds
Display a3 of GEOS-5 modeled clouds
Display b1 of GEOS-5 modeled clouds
Display b2 of GEOS-5 modeled clouds
Display b3 of GEOS-5 modeled clouds
Display c1 of GEOS-5 modeled clouds
Display c2 of GEOS-5 modeled clouds
Display c3 of GEOS-5 modeled clouds
Display d1 of GEOS-5 modeled clouds
Display d2 of GEOS-5 modeled clouds
Display d3 of GEOS-5 modeled clouds
Display e1 of GEOS-5 modeled clouds
Dsiplay e2 of GEOS-5 modeled clouds
Display e3 of GEOS-5 modeled clouds
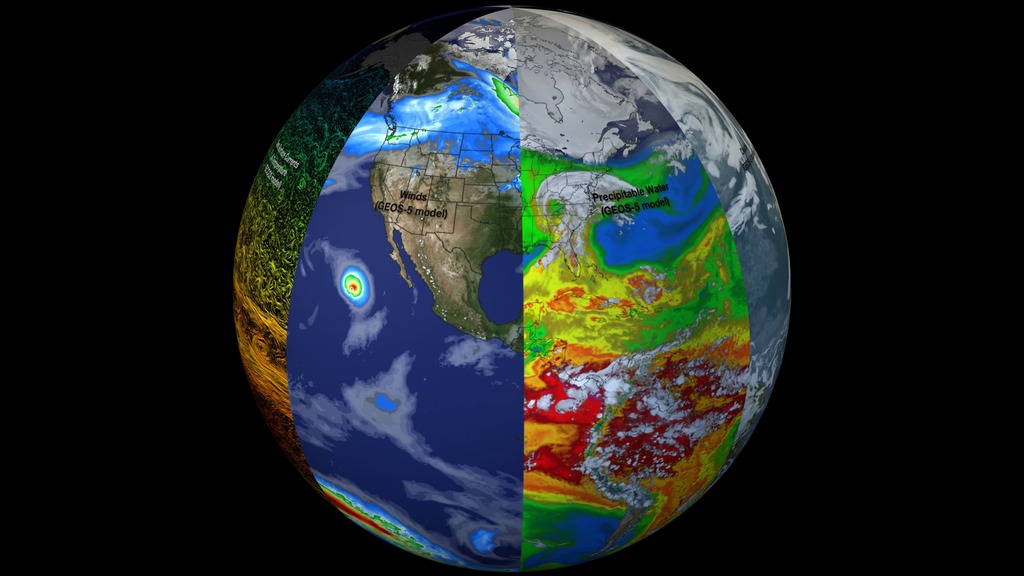
This is an alternate version of the movie with a different background.
Credits
Please give credit for this item to:
NASA/Goddard Space Flight Center Scientific Visualization Studio
-
Animator
-
Greg Shirah
(NASA/GSFC)

-
Greg Shirah
(NASA/GSFC)
-
Producer
- Michelle Williams (UMBC)
-
Scientists
- William Putman (NASA/GSFC)
- Max J. Suarez (NASA/GSFC)
-
Project support
- Eric Sokolowsky (Global Science and Technology, Inc.)
Missions
This page is related to the following missions:Series
This page can be found in the following series:Datasets used
-
BMNG (Blue Marble: Next Generation) [Terra and Aqua: MODIS]
ID: 508Credit: The Blue Marble data is courtesy of Reto Stockli (NASA/GSFC).
This dataset can be found at: http://earthobservatory.nasa.gov/Newsroom/BlueMarble/
See all pages that use this dataset -
GEOS-5 Cubed-Sphere (GEOS-5 Atmospheric Model on the Cubed-Sphere)
ID: 663The model is the GEOS-5 atmospheric model on the cubed-sphere, run at 14-km global resolution for 30-days. GEOS-5 is described here http://gmao.gsfc.nasa.gov/systems/geos5/ and the cubed-sphere work is described here http://sivo.gsfc.nasa.gov/cubedsphere_overview.html.
See all pages that use this dataset
Note: While we identify the data sets used on this page, we do not store any further details, nor the data sets themselves on our site.
Related
- ID: 3793
 Visualization
Sources
- ID: 30701
 Hyperwall Visual
Used as a Source In
- ID: 12126
Release date
This page was originally published on Friday, June 18, 2010.
This page was last updated on Sunday, October 13, 2024 at 10:01 PM EDT.