Sea Surface Temperature, Salinity and Density
Sea Surface Temperature
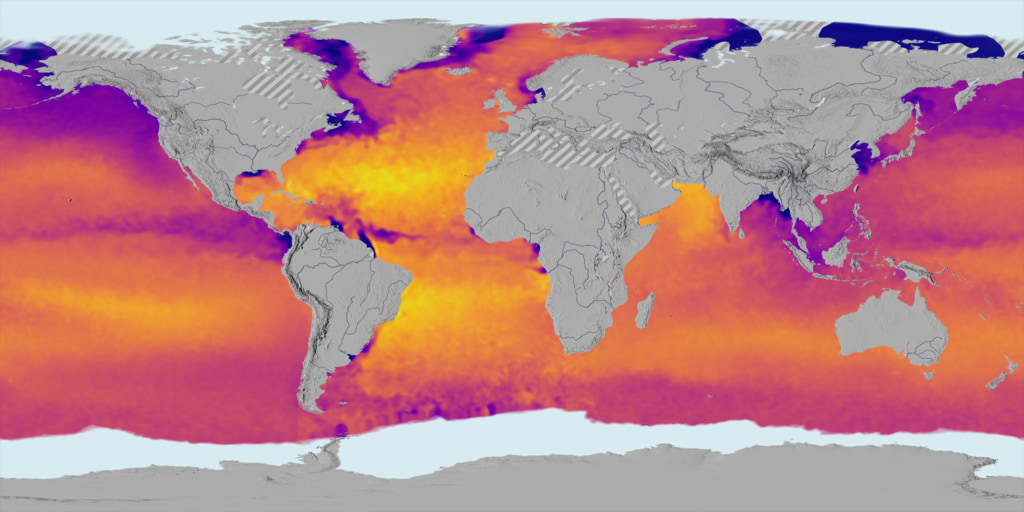
The oceans of the world are heated at the surface by the sun, and this heating is uneven for many reasons. The Earth's axial rotation, revolution about the sun, and tilt all play a role, as do the wind-driven ocean surface currents. The first animation in this group shows the long-term average sea surface temperature, with red and yellow depicting warmer waters and blue depicting colder waters. The most obvious feature of this temperature map is the variation of the temperature by latitude, from the warm region along the equator to the cold regions near the poles. Another visible feature is the cooler regions just off the western coasts of North America, South America, and Africa. On these coasts, winds blow from land to ocean and push the warm water away from the coast, allowing cooler water to rise up from deeper in the ocean.
An animation of average Sea Surface Temperature on a globe.
.This product is available through our Web Map Service.")
Global map of average Sea Surface Temperature (SST).
This product is available through our Web Map Service.
Sea Surface Temperature color scale
Sea Surface Salinity
The heat of the sun also forces evaporation at the ocean's surface, which puts water vapor into the atmosphere but leaves minerals and salts behind, keeping the ocean salty. The salinity of the ocean also varies from place to place, because evaporation varies based on the sea surface temperature and wind, rivers and rain storms inject fresh water into the ocean, and melting or freezing sea ice affects the salinity of polar waters. The second animation in this group shows the long term average sea surface salinity, where white regions have the highest salinity and dark regions the lowest. Notice the higher salinity in the Atlantic than the Pacific, due to the greater rainfall amounts in the Pacific, and the lower salinity at the mouths of major rivers.
An animation of average Sea Surface Salinity on a globe.
Global map of average Sea Surface Salinity (SSS).
This product is available through our Web Map Service.
Sea Surface Salinity color scale
Sea Surface Density
The average density of sea surface water can be calculated from the average sea surface temperature and salinity using the state equation for seawater. The third animation shows the long term average sea surface density, with light blue regions having the least density and dark blue regions having the greatest density. The sea surface density variations are actually very small, less than 3% overall, but the variation is very important. There are three stable, dense regions in the ocean's surface, one in the sea around Iceland, Greenland, and Scandinavia and the other two near or under major Antarctic ice shelves. In these regions, the surface water becomes dense enough to sink and join the deep ocean currents. In fact, this sinking is thought to drive these deep currents as part of a system called the Thermohaline Circulation (see the animation The Thermohaline Circulation - The Great Ocean Conveyor Belt). This circulation has a strong effect on the Earth's climate, influencing the Gulf Stream, El Niño events, and both past and future Climate Shifts.
An animation of average Sea Surface Density on a globe.
Global map of average Sea Surface Density.
This product is available through our Web Map Service.
Sea Surface Density color scale
Other Effects of Ocean Salinity
The link between ocean temperature, salinity, and density also has other consequences. Research shows that over the past few decades, vast regions of abnormal sea surface salinity - called Great Salinity Anomalies - have propagated around the far north Atlantic, impacting local ecosystems and the sinking of water masses. At mid-latitudes, salinity influences the depth to which water masses sink and how far they extend through the ocean. The location and depth of these water masses controls how heat and salt are transported between the tropics and high latitudes. Like atmospheric fronts that bring unstable weather, ocean fronts found at the interface between water masses are areas of high activity often correlated with important fisheries such as tuna.
In the tropics, sea surface salinity is primarily controlled by rainfall and river runoff; these sources of freshwater regulate how the oceans interact with the atmosphere. Affecting almost half of the world's human population each year, monsoons are driven by exchanges at the air-ocean boundary. Likewise, El Niño has profound effects on humankind and is, to an unknown extent, governed by ocean salinity. In fact, recent studies indicate that understanding salinity's effect on upper ocean buoyancy may be the key to better El Niño forecasts.
The long term averages (or "climatologies") of sea surface temperature and salinity used in these animations come from the World Ocean Atlas 2005 (WOA2005)
Credits
Please give credit for this item to:
NASA/Goddard Space Flight Center Scientific Visualization Studio
The Blue Marble Next Generation data is courtesy of Reto Stockli (NASA/GSFC) and NASA's Earth Observatory.
-
Animators
- Helen-Nicole Kostis (UMBC)
- Horace Mitchell (NASA/GSFC)
-
Greg Shirah
(NASA/GSFC)

-
Producer
- Ryan Fitzgibbons (UMBC)
-
Scientist
- Susan Lozier (Duke University)
Missions
This page is related to the following missions:Series
This page can be found in the following series:Datasets used
-
GTOPO30 Topography and Bathymetry
ID: 274 -
BMNG (Blue Marble: Next Generation) [Terra and Aqua: MODIS]
ID: 508Credit: The Blue Marble data is courtesy of Reto Stockli (NASA/GSFC).
This dataset can be found at: http://earthobservatory.nasa.gov/Newsroom/BlueMarble/
See all pages that use this dataset -
Temperature (World Ocean Atlas 2005 (WOA05) Annual Temperature Climatology)
ID: 659
Note: While we identify the data sets used on this page, we do not store any further details, nor the data sets themselves on our site.
Related
- ID: 5017
 Visualization
Release date
This page was originally published on Friday, October 9, 2009.
This page was last updated on Wednesday, May 3, 2023 at 1:54 PM EDT.