A newer version of this visualization is available.
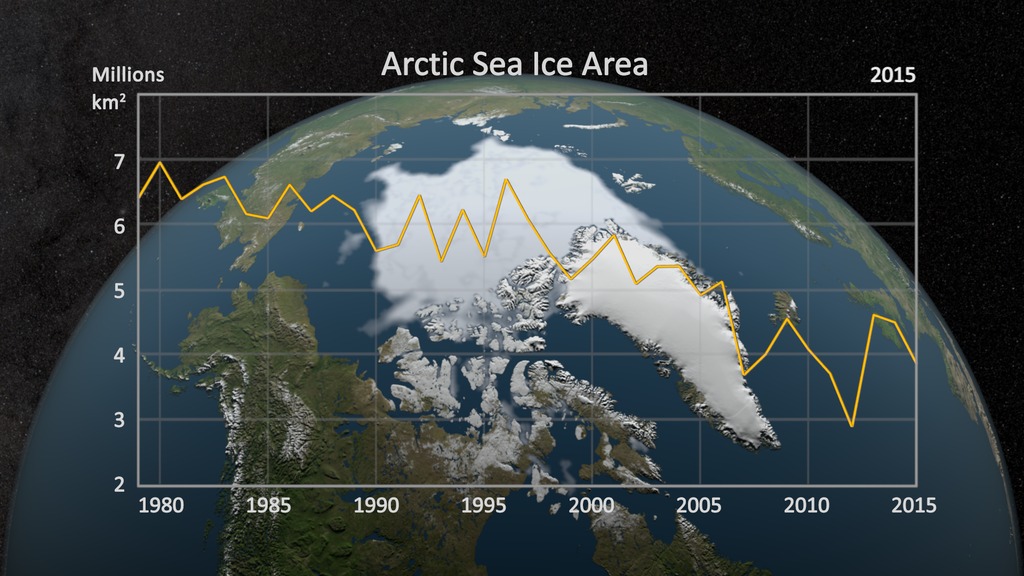
Sea Ice Minimum Concentration for 1979-2005
This animation shows the annual minimum sea ice extent and concentration for 25 years, from 1979 to 2005. Average climatology from 1979 to 2004 which is shown as a yellow outline is also included.
Three year moving average are shown from 1979-1981 through 2003-2005.
Yearly sea ice concentrations 1979 to 2005 (with dates and climatology average)

Yearly sea ice concentrations 1979 to 2005
Date overlay files corresponding to yearly sea ice
Sea ice climatology averages from 1979 to 2004 with 2 pixel wide line
Sea ice climatology averages from 1979 to 2004 with 5 pixel wide line
Sea ice from Sep 21, 1979
Sea ice from Sep 21, 2005
Sea ice from Sep 21, 2005 (with climatology outline)
Credits
Please give credit for this item to:
NASA/Goddard Space Flight Center
Scientific Visualization Studio
-
Animators
-
Greg Shirah
(NASA/GSFC)

- James W. Williams (Global Science and Technology, Inc.)
-
Greg Shirah
(NASA/GSFC)
-
Scientist
- Josefino Comiso (NASA/GSFC)
Missions
This page is related to the following missions:Datasets used
-
[DMSP: SSM/I]
ID: 11Defense Meteorological Satellite Program Special Sensor Microwave Imager
See all pages that use this dataset -
Blue Marble [Aqua: MODIS]
ID: 252Credit: The Blue Marble data is courtesy of Reto Stockli (NASA/GSFC).
See all pages that use this dataset -
[GTOPO30]
ID: 415 -
Blue Marble [Terra: MODIS]
ID: 492Credit: The Blue Marble data is courtesy of Reto Stockli (NASA/GSFC).
See all pages that use this dataset -
Comiso's September Minimum Sea Ice Concentration
ID: 540
Note: While we identify the data sets used on this page, we do not store any further details, nor the data sets themselves on our site.
Newer Versions
- ID: 4435
 Visualization
Release date
This page was originally published on Tuesday, September 27, 2005.
This page was last updated on Wednesday, May 3, 2023 at 1:56 PM EDT.