A newer version of this visualization is available.
Sea Ice Minimum Concentration 3-year moving averages for 1979-1981 to 2003-2005
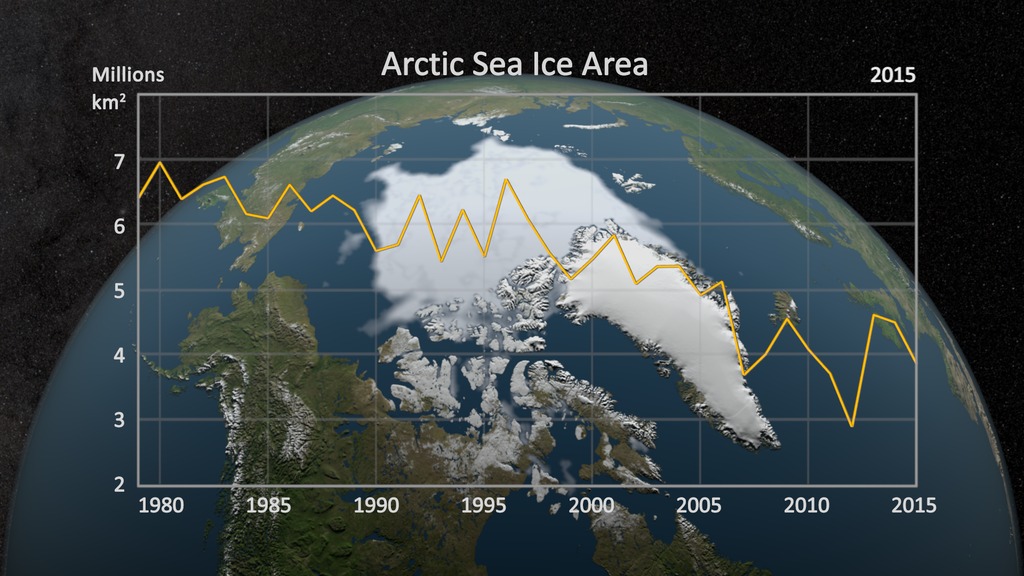
This animation shows a 3-year moving average of minimum sea ice concentration for from 1979-1981 through 2003-2005. Average climatology from 1979 to 2004 which is shown as a yellow outline is also included. This line represents the average location of the edge of perennial sea ice cover.
Sea ice concentration3-year moving average from 1979-1981 through 2003-2005

Sea ice climatology averages from 1979 to 2004 with 2 pixel wide line
Sea ice climatology averages from 1979 to 2004 with 5 pixel wide line
Sea ice concentration3-year average from 1979-1981
Sea ice concentration3-year average from 2003-2005
Credits
Please give credit for this item to:
NASA/Goddard Space Flight Center
Scientific Visualization Studio
-
Animators
-
Greg Shirah
(NASA/GSFC)

- James W. Williams (Global Science and Technology, Inc.)
-
Greg Shirah
(NASA/GSFC)
-
Scientist
- Josefino Comiso (NASA/GSFC)
Missions
This page is related to the following missions:Datasets used
-
[DMSP: SSM/I]
ID: 11Defense Meteorological Satellite Program Special Sensor Microwave Imager
See all pages that use this dataset -
Blue Marble [Aqua: MODIS]
ID: 252Credit: The Blue Marble data is courtesy of Reto Stockli (NASA/GSFC).
See all pages that use this dataset -
[GTOPO30]
ID: 415 -
Blue Marble [Terra: MODIS]
ID: 492Credit: The Blue Marble data is courtesy of Reto Stockli (NASA/GSFC).
See all pages that use this dataset -
Comiso's September Minimum Sea Ice Concentration
ID: 540
Note: While we identify the data sets used on this page, we do not store any further details, nor the data sets themselves on our site.
Newer Versions
- ID: 4435
 Visualization
Release date
This page was originally published on Tuesday, September 27, 2005.
This page was last updated on Wednesday, May 3, 2023 at 1:56 PM EDT.