A newer version of this visualization is available.
Monthly Outgoing Longwave Radiation
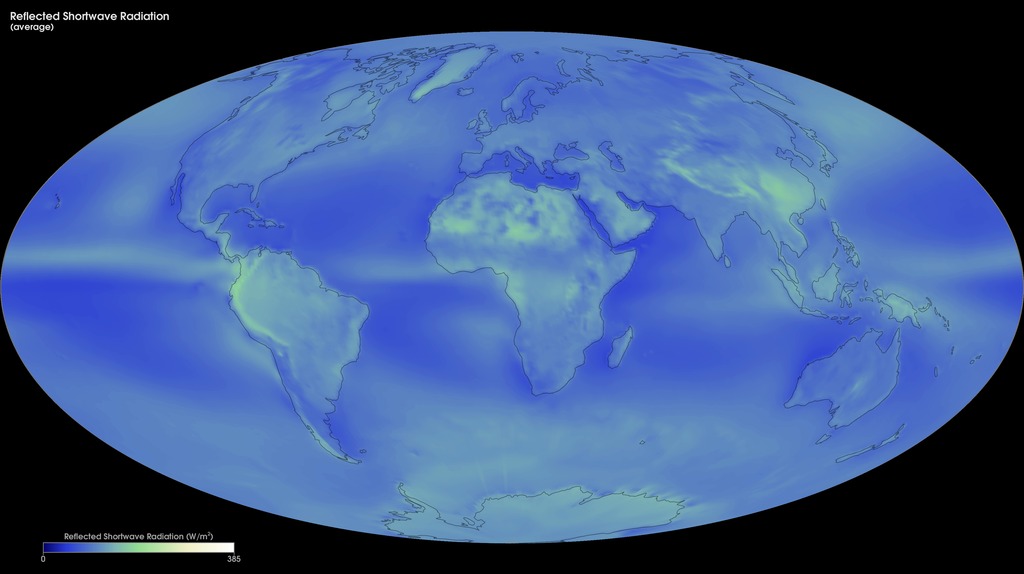
Light energy travels in waves, but not all the waves are the same. The kind of light our eyes can see is only a tiny part of the energy that exists in the universe. Other kinds of energy are invisible, like the energy that makes our hands feel warm when we hold them over a fire, or the energy that cooks our food in the microwave. When Earth absorbs sunlight, it heats up. The heat, or "outgoing longwave radiation," radiates back into space. Satellites measure this radiation as it leaves the top of Earth's atmosphere. The hotter a place is, the more energy it radiates. These maps show monthly outgoing longwave radiation from July 2006 to the present, from the Fast Longwave And Shortwave Radiative Fluxes, or FLASHFlux, Time Interpolation and Spatial Averaging (TISA) data product. The product contains daily observations collected by the Clouds and the Earth's Radiant Energy System (CERES) sensors on NASA's Aqua and Terra satellites. The colors show the amount of outgoing longwave radiation leaving Earth's atmosphere (in Watts per square meter). Bright yellow and orange indicate greater heat emission, purple and blue indicate intermediate emissions, and white shows little or no heat emission.
Monthly outgoing longwave radiation using CERES data, July 2006 - present.
For More Information
Credits
Based on imagery by Jesse Allen, NASA Earth Observatory, based on FLASHFlux data. FLASHFlux data are produced using CERES observations convolved with MODIS measurements from both the Terra and Aqua satellite. Data provided by the FLASHFlux team, NASA Langley Research Center.
-
Visualizers
- Marit Jentoft-Nilsen (Global Science and Technology, Inc.)
- Jesse Allen (Sigma Space Corporation)
Series
This page can be found in the following series:Datasets used
-
Outgoing Longwave Radiation Flux [Aqua: CERES]
ID: 247 -
Outgoing Longwave Radiation [Terra: CERES]
ID: 485
Note: While we identify the data sets used on this page, we do not store any further details, nor the data sets themselves on our site.
Newer Versions
- ID: 30604
 Hyperwall Visual
Release date
This page was originally published on Wednesday, October 23, 2013.
This page was last updated on Sunday, February 2, 2025 at 11:31 PM EST.