A newer version of this visualization is available.
CERES Radiation Fluxes
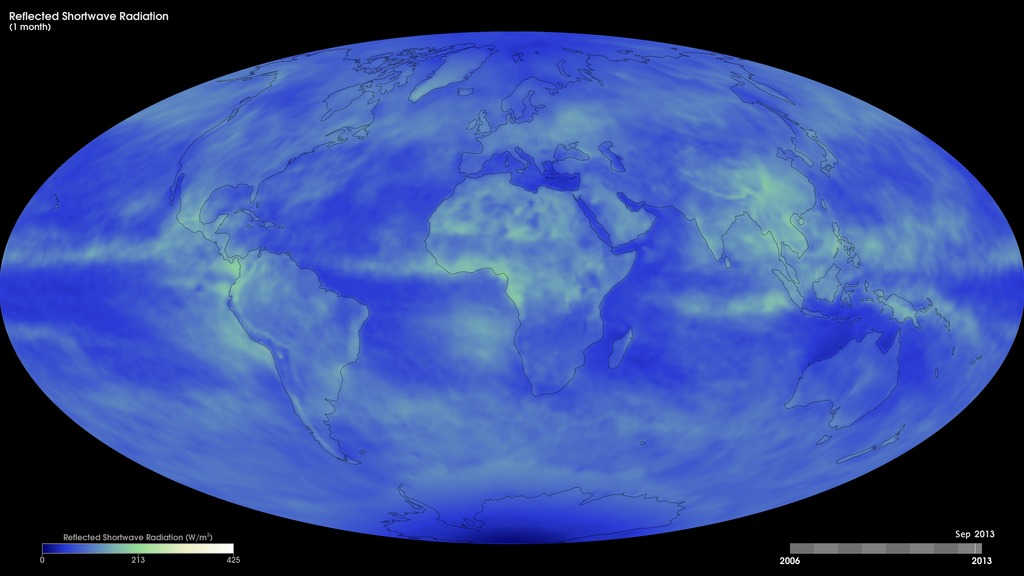
These maps show monthly reflected-shortwave radiation from March 2000 to the present from the Energy Balanced and Filled (EBAF) data product. These data are produced by averaging observations collected by the Clouds and the Earth's Radiant Energy System (CERES) sensors on NASA's Aqua and Terra satellites, filling in gaps and constraining the fluxes to remove the inconsistency between average global net TOA flux and heat storage in the Earth-atmosphere system.

Total reflected shortwave radiation averaged over the years 2000-2015. The colors in this image show the amount of shortwave energy (in Watts per square meter) that was reflected by the Earth system. The brighter, whiter regions show where more sunlight is reflected, while green regions show intermediate values, and blue regions are lower values.
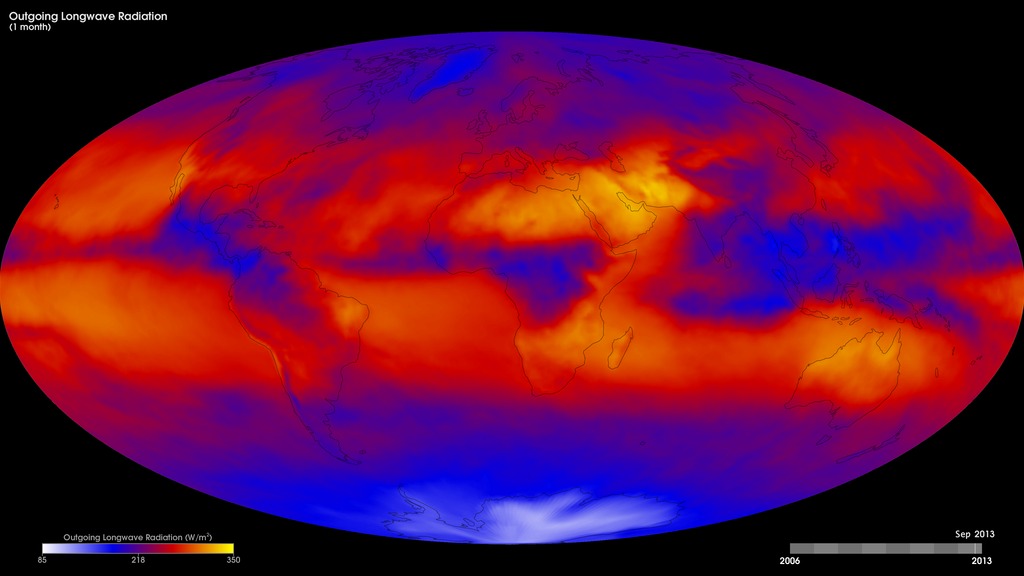
Total emitted longwave radiation averaged over the years 2000-2015. The colors in this image show the amount of outgoing longwave radiation leaving Earth's atmosphere (in Watts per square meter). Bright yellow and orange indicate greater heat emission, purple and blue indicate intermediate emissions, and white shows little or no heat emission.
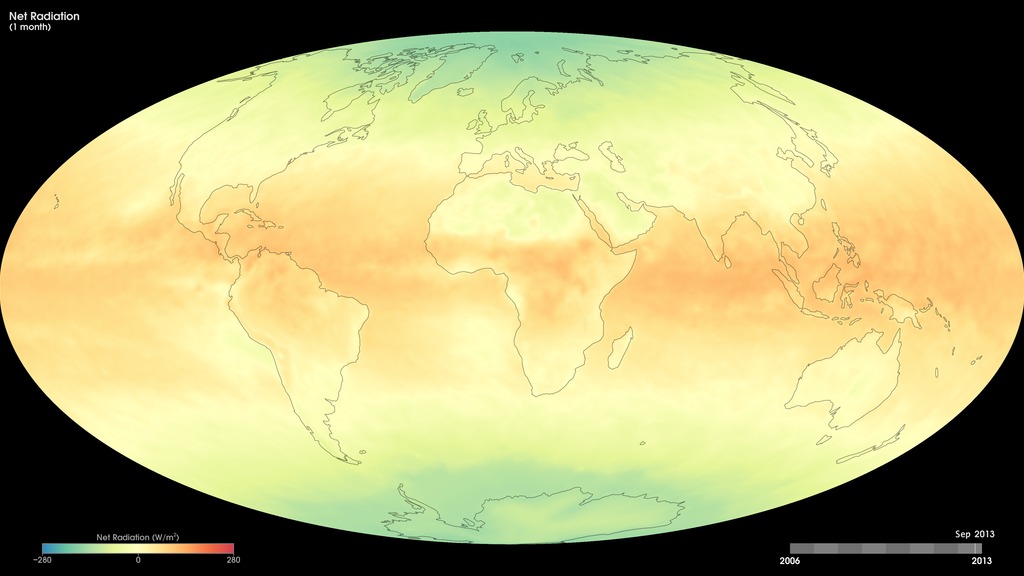
Total net Radiation averaged over the years 2000-2015. The colors in this image show the net radiation (in Watts per square meter) that was contained in the Earth system. The maps illustrate the fundamental imbalance between net radiation surpluses in the lower latitudes (red areas), where sunlight is direct year-round, and net radiation deficits at high latitudes (green areas), where direct sunlight is seasonal.
Animation of monthly shortwave radiation. The colors in this animation show the amount of shortwave energy (in Watts per square meter) that was reflected by the Earth system. The brighter, whiter regions show where more sunlight is reflected, while green regions show intermediate values, and blue regions are lower values.
Aniation of monthly longwave radiation. The colors in this animation show the amount of outgoing longwave radiation leaving Earth's atmosphere (in Watts per square meter). Bright yellow and orange indicate greater heat emission, purple and blue indicate intermediate emissions, and white shows little or no heat emission.
Animation of monthly net radiation. The colors in this animation show the net radiation (in Watts per square meter) that was contained in the Earth system. The maps illustrate the fundamental imbalance between net radiation surpluses in the areas receiving more incoming sunlight (red areas), and net radiation deficits (green areas), where direct sunlight is seasonal.
For More Information
Credits
Please give credit for this item to:
NASA's Goddard Space Flight Center
-
Project support
- Marit Jentoft-Nilsen
- Amy Moran (Global Science and Technology, Inc.)
-
Writer
- Heather Hanson (Global Science and Technology, Inc.)
Release date
This page was originally published on Sunday, June 28, 2015.
This page was last updated on Tuesday, November 14, 2023 at 12:27 AM EST.
Related
- ID: 30603
 Hyperwall Visual
Newer Versions
- ID: 31059
 Hyperwall Visual
Older Versions
- ID: 30369
 Hyperwall Visual
 - ID: 30370
 Hyperwall Visual
 - ID: 30368
 Hyperwall Visual