Tour 2022: NASA's Upcoming Earth Missions
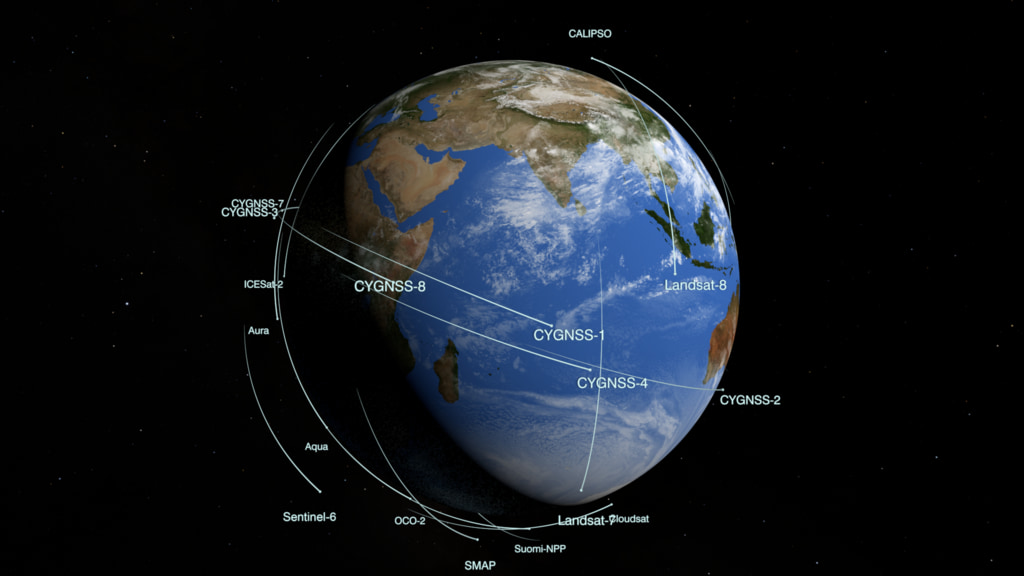
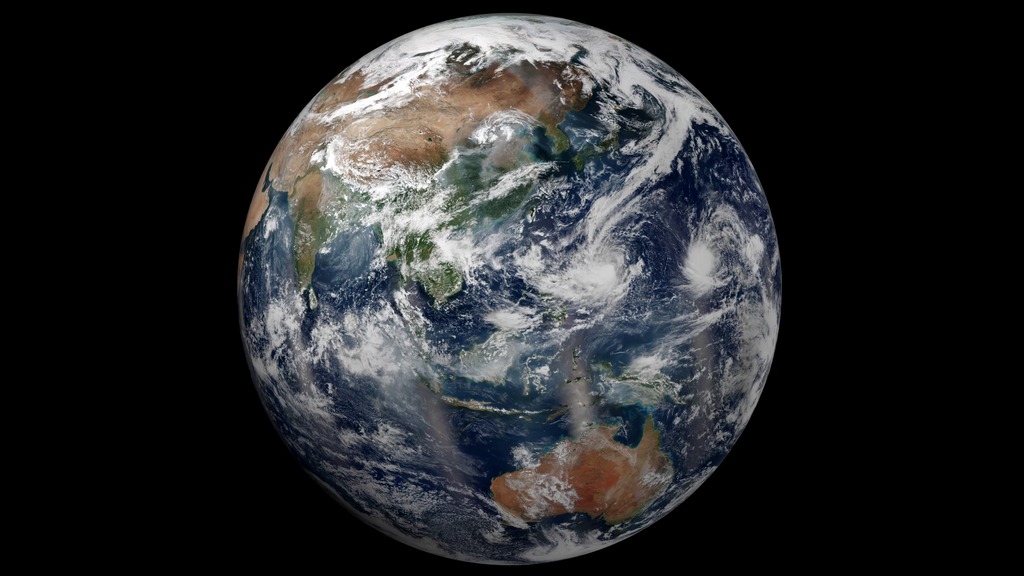
- Produced by:
- Jefferson Beck,
- Kathleen Gaeta,
- Kathryn Mersmann, and
- Katie Jepson
- View full credits
Movies
- 14043_2022Launches.mp4 (1920x1080)
- 14043_2022Launches.mov (1920x1080)
- 14043_2022Launches.webm (1920x1080)
Images
- Screen_Shot_2021-12-09_at_3.50.54_PM_print.jpg (1024x574)
- Screen_Shot_2021-12-09_at_3.50.54_PM.png (3028x1700)
- Screen_Shot_2021-12-09_at_3.50.54_PM_thm.png (80x40)
- Screen_Shot_2021-12-09_at_3.50.54_PM_searchweb.png (320x180)
Right click movies to download them if they automatically play in your browser.
Music: "Kitchen Preparations," "Kinky Boots," "Bossa Baby," "Pleasantville" and "Exotic Encounter" from Universal Production Music
Complete transcript available.
Take a tour of missions launching in 2022, including SWOT, TROPICS, EMIT, and JPSS-2.

Images
- SWOT2.gif (1037x684)
Right click movies to download them if they automatically play in your browser.
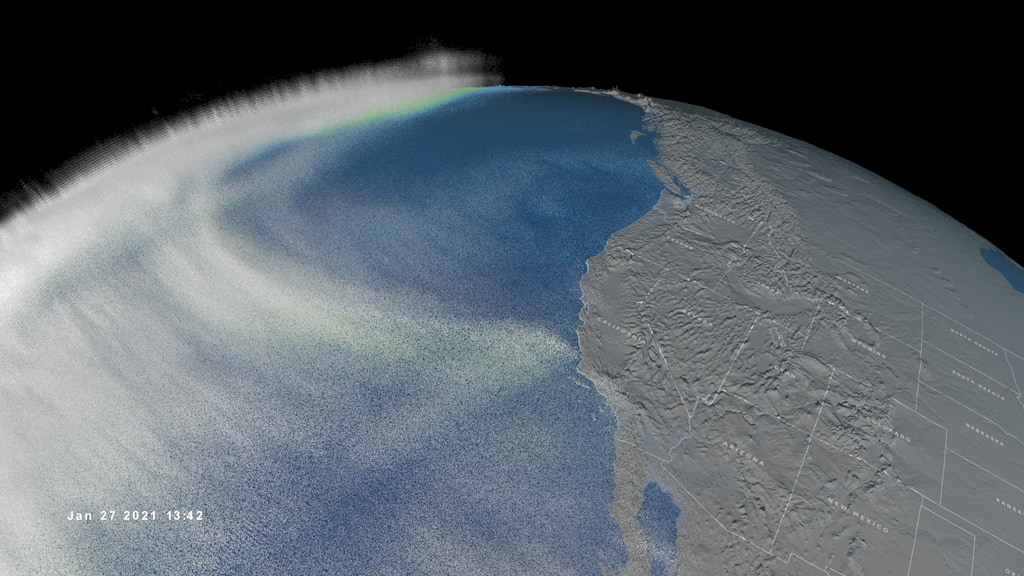
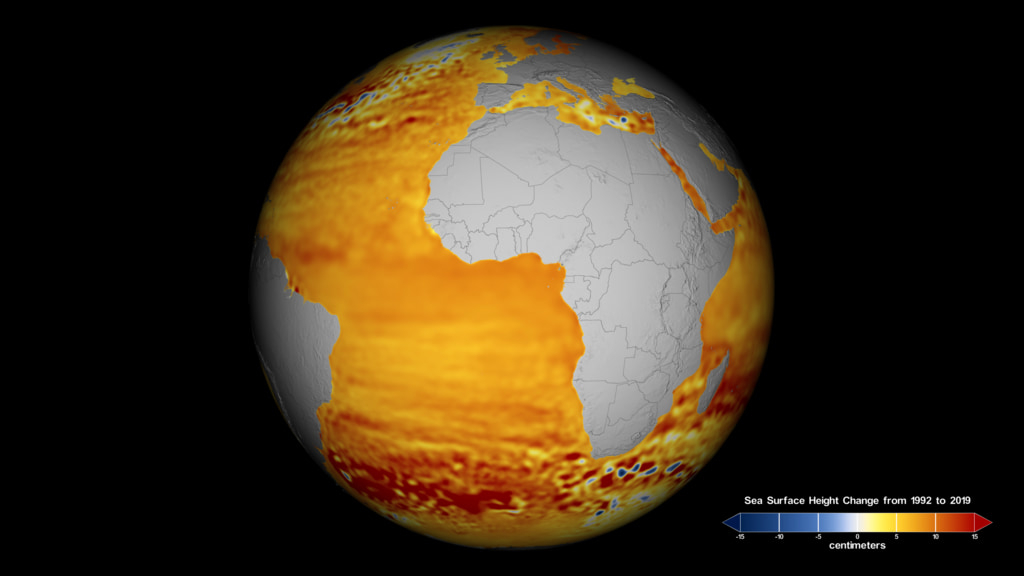
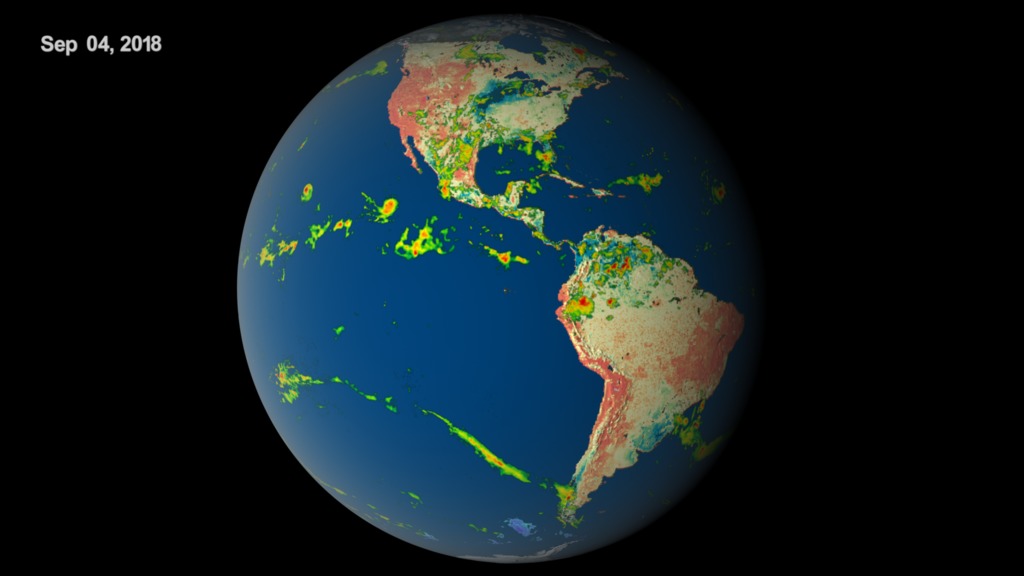
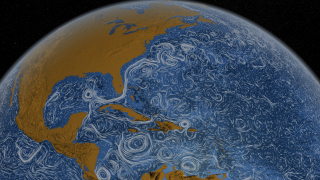
The Surface Water and Ocean Topography mission — SWOT — focuses on the planet’s most precious resource: Water. SWOT will help researchers compile the first global survey of Earth’s surface freshwater and study our changing ocean.

Images
- TROPICS.gif (1280x843)
Right click movies to download them if they automatically play in your browser.
We’re also launching TROPICS — six small satellites designed to help scientists better understand tropical storms and hurricanes. Traveling in pairs in three different orbits, TROPICS will provide near-hourly observations of a storm’s precipitation, temperature, and humidity.

Images
- EMIT.gif (1280x819)
Right click movies to download them if they automatically play in your browser.
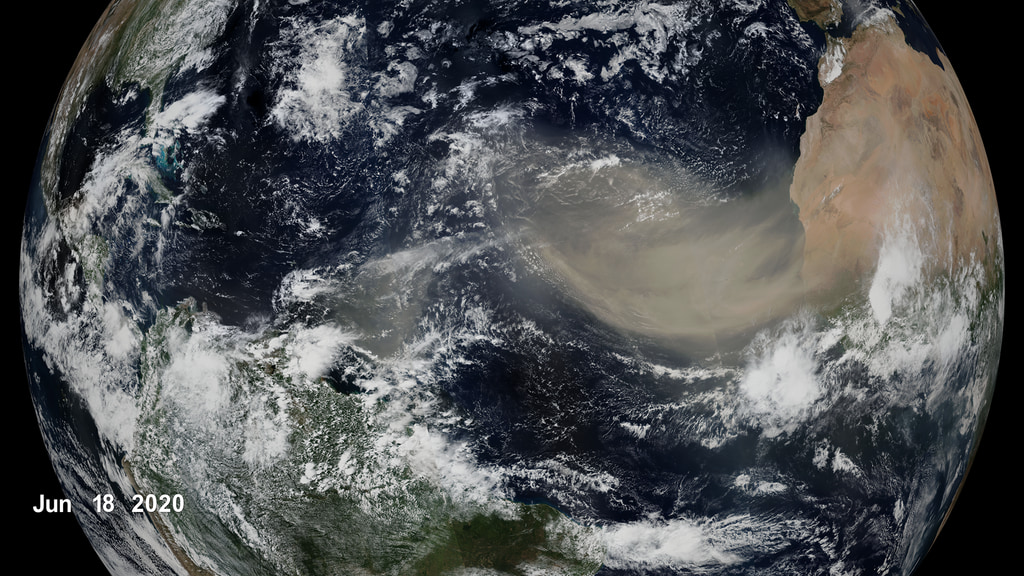
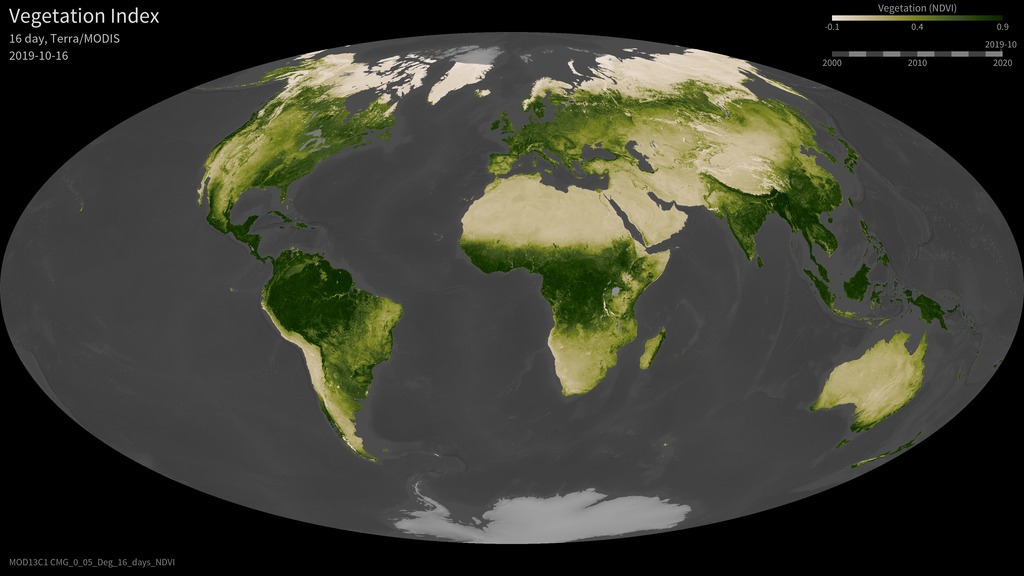
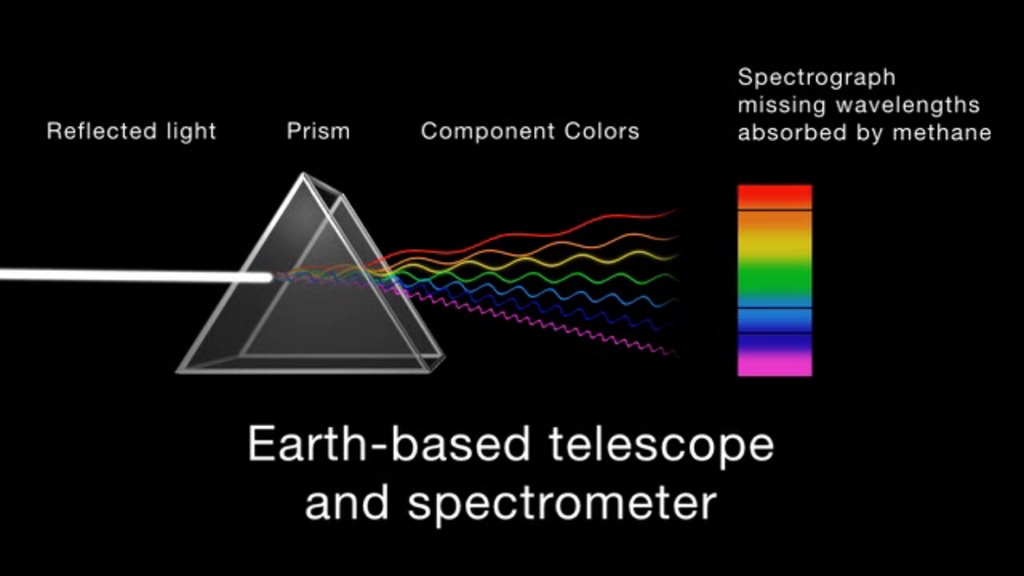
Winds on Earth kick up millions of tons of dust every year. EMIT will use spectroscopy to “fingerprint” different types of dust from its perch on the International Space Station, helping scientists map the areas on Earth that produce different types of dust.

Images
- JPSS2.gif (1280x819)
Right click movies to download them if they automatically play in your browser.
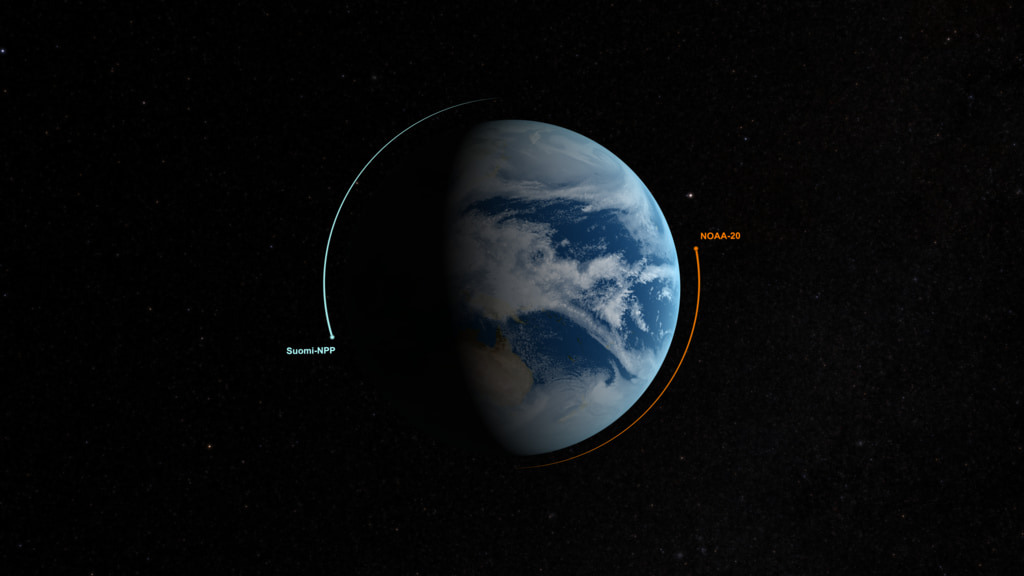
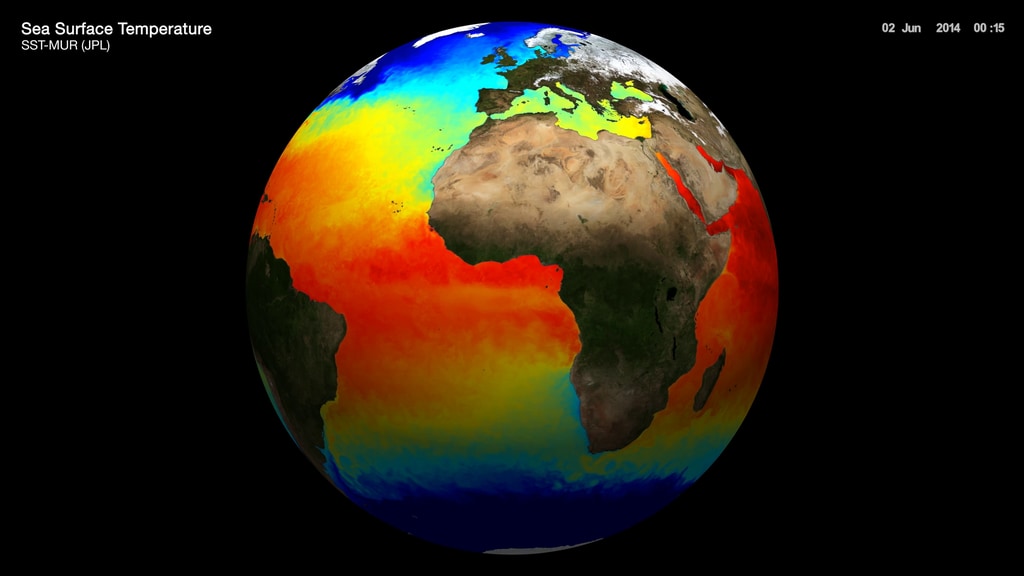
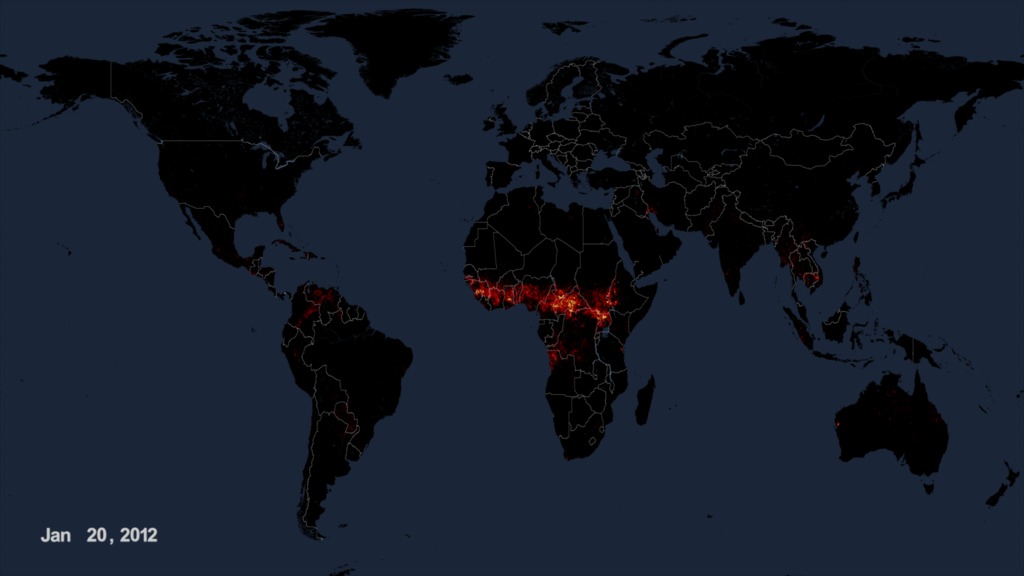
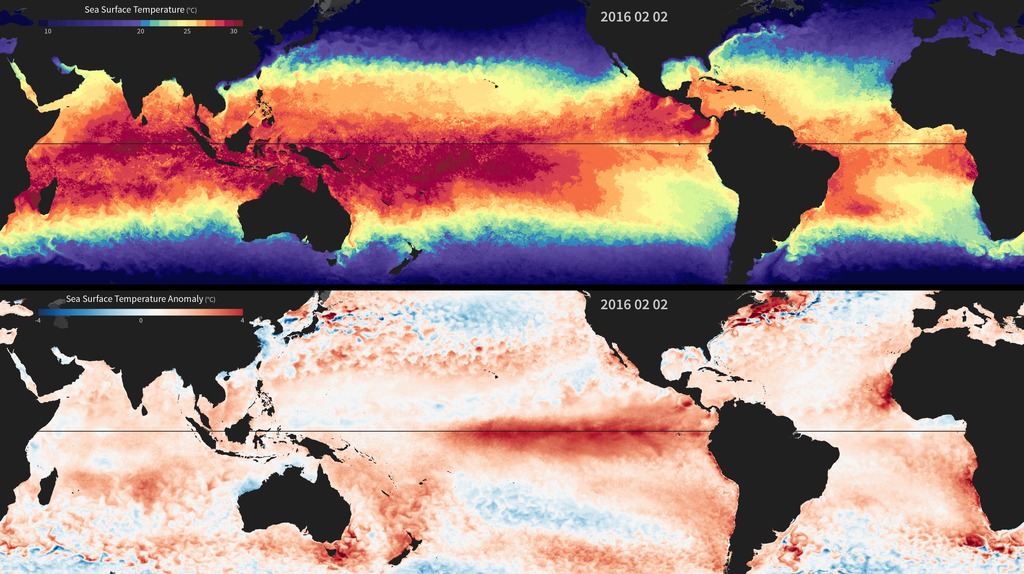
We’ve worked with our partners at NOAA to study Earth for decades. In 2022, the JPSS-2 mission will continue that legacy of monitoring weather, sea surface temperatures, algal blooms, clouds, rainfall, heat, smoke, dust storms, ozone, and air quality.
Credits
Please give credit for this item to:
NASA's Goddard Space Flight Center
Writers
- Alison Gold (NASA)
- Ellen T. Gray (NASA/HQ)
Producers
- Jefferson Beck (KBRwyle) [Lead]
- Kathleen Gaeta (AIMM) [Lead]
- Kathryn Mersmann (KBRwyle) [Lead]
- Katie Jepson (KBRwyle) [Lead]
Series
This visualization can be found in the following series:Related pages
NOAA and NASA Continue Mission to Monitor Extreme Weather and EnhanceForecasts with JPSS-2 Launchin…
Oct. 20, 2022, 2 a.m.
Read moreAssociated cut b-roll and pre-recorded interview will be added on Friday, Oct 28th by 4:00 p.m. ET The impacts of extreme weather can be felt all around the planet, from hurricanes to wildfires and everything in between. Meteorologists bring us invaluable information about weather, and make life-saving predictions using data from NOAA satellites. On Nov. 1, NASA is scheduled to launch NOAA’s JPSS-2, the third of a series of vital Earth-observing satellites that will gather data and help protect lives and property. JPSS-2 will orbit the globe 14 times a day, passing over every single spot on Earth at least twice daily, taking measurements and snapping images that feed our daily weather forecasts, help us plan for severe weather and track global climate change. JPSS satellites map and monitor wildfires and volcanoes. They measure what’s going on inside of tropical cyclones. They tell us about extreme heat, drought and crop health. And they track harmful algal blooms and sea ice in our oceans. The satellites also measure the dust, smoke and smog that travels the globe and impacts the air we breathe. The data from these satellites are not only used by meteorologists- they’re also used by pilots, first responders, football coaches, and anyone who logs onto a smartphone app to check the weather!For more information about JPSS visit: https://www.nesdis.noaa.gov/next-generation/jpss-2-launch Live interviews will be offered on Monday, Oct. 31 from 6:00 a.m.- 1:00 p.m. EASTERN TimeClick here to request an interview: https://forms.gle/yf4XXUFSGaZSetxR8 Form will close at 12:00 p.m. ET on Friday, Oct. 28Requests sent via the above form will have scheduling priority. Please do not email requests.Suggested Anchor Intro:Whether you’re looking at our weather forecast here or on your phone, chances are you’re using data from a system of satellites called JPSS. Today/Tomorrow/Tonight NASA is launching NOAA’s latest installment of the series, called JPSS-2. This satellite is going to bring data that will help meteorologists make life-saving predictions even days in advance. Here to tell us more about it is NOAA expert XX. Suggested Questions:Tomorrow is an exciting day - NASA is launching NOAA’s newest extreme weather observing satellite. Can you tell us more about this mission?How do JPSS satellites help better predict severe weather and provide more accurate forecasts?Florida is still reeling from the recent impact of Hurricane Ian. Can you talk about how NOAA satellites monitored the storm and helped emergency managers prepare? How is data from JPSS helping us better understand how the climate is changing?Where can our viewers go to learn more about JPSS?Questions for longer interviews:I understand that an inflatable heat shield will be hitching a ride into space during this launch to test a new technology. Can you tell us more about this demonstration and what NASA is hoping to learn from this test? How does JPSS-2 differ from other weather satellites like GOES?How will this new satellite work with other satellites in the Earth-observing fleet?JPSS will orbit the Earth from pole to pole at just over 500 miles above the surface, that’s pretty close as far as satellites go. Why is this type of orbit used? Do you have feedback for the Live Shot Program or want to be removed from our contact list? We would love to hear from you HERE!
3D Water Vapor shows an Atmospheric River
Oct. 6, 2021, 8 p.m.
Read moreThis visualization shows the NOAA-20 satellite orbiting the Earth with a trail of 3D water vapor behind it collected between January 25 and 28, 2021. The calculated total precipitable water (TPW) is shown in a blue to red color scale beneath the white water vapor.Coming soon to our YouTube channel. The NOAA-20 satellite, formerly named JPSS-1, was launched in November 2017 to gather global measurements of atmospheric, terrestrial and oceanic conditions. These measurements are used to increase the speed and accuracy of weather models run by NOAA s National Weather Service to forecast severe weather such as hurricanes, tornadoes and blizzards as well as to assess environmental hazards such as droughts, poor air quality and forest fires. NOAA-20 is a polar-orbiting satellite that crosses the equator about 14 times a day, covering the entire globe twice daily. The Advanced Technology Microwave Sounder (ATMS), the source of data used in this visualization, is an instrument on NOAA-20 that collects 3-dimensional atmospheric temperature and moisture profiles.In this visualization the swaths of 3D water vapor are revealed as the NOAA-20 satellite circumnavigates the globe. Water vapor is shown as clouds of white particles with higher density (more opaque) where the water vapor is denser and lower density (more transparent) in regions of less water vapor.Beneath the water vapor the total precipitable water (TPW) is shown as a color on the surface of the globe with low values in blues and high values shown in red. TPW is the sum of all forms of water (ice, snow, rain, water vapor) through the column at all altitudes in the atmosphere. Toward the end of this visualization, about 12-hour time steps are shown in sequence to reveal the structure of the atmospheric river that formed in the Pacific ocean and approached the west coast of the United States in January 2021. Here the low values of the TPW have been faded out in order to more clearly see the water vapor of the atmospheric river as it progresses down the coastline. A total of 21,600 data files are combined in order to portray the water vapor and the TPW over a four day time period. The topography is exaggerated by 20 times at the beginning of the animation and is reduced to 12 times as the view moves closer to the west coast of the US. The water vapor is exaggerated by 100 time at the start of the visualization and is reduced to 66 times for the closer views. A high resolution still image from the visualization showing the NOAA-20 satellite orbiting the earth on January 25, 2021 at 04:54 GMT with the swath of water vapor over the total precipitable water trailing behind it. A high resolution still image from the visualization showing the NOAA-20 satellite orbiting the earth on January 25, 2021 at 09:06 GMT with the swath of water vapor over the total precipitable water trailing behind it. A high resolution still image from the visualization showing the water vapor from an atmospheric river forming in the Pacific Ocean off the coast of the US on January 26, 2021 at 14:46 GMT. The colorbar used for the total precipitable water
Earth Observing Fleet (August 2021)
Aug. 25, 2021, 8 p.m.
Read moreEarth observing fleet for August 2021 - this version labels the spacecraft: Sentinel-6 Michael Freilich Earth observing fleet without satellite labels
How a Squad of Small Satellites Will Help NASA Study Storms
July 1, 2021, 9 a.m.
Read moreComplete transcript available.Universal Production Music: Patisserie Pressure by Benjamin James Parsons [PRS] This video can be freely shared and downloaded. While the video in its entirety can be shared without permission, some individual imagery is provided by pond5.com and is obtained through permission and may not be excised or remixed in other products. Specific details on stock footage may be found here. For more information on NASA’s media guidelines, visit https://www.nasa.gov/multimedia/guidelines/index.html. Hurricanes are some of the most powerful and destructive weather events on Earth. To help study these powerful storms, NASA is launching TROPICS (Time-Resolved Observations of Precipitation structure and storm Intensity with a Constellation of Smallsats), a collection of 6 small satellites designed to measure storm strength by detecting the thermal radiation naturally emitted by the oxygen and water vapor in the air. In June 2021, NASA launched a test version of the satellite, called a pathfinder, ahead of the constellation of six weather satellites planned for launch in 2022. When launched, the TROPICS satellites will work together to provide near-hourly microwave observations of a storm s precipitation, temperature, and humidity. The mission is expected to help scientists understand the factors driving tropical cyclone intensification and to improve forecasting models.
Godzilla Dust Storm
April 19, 2021, 5:30 a.m.
Read moreVisualization of the Godzilla Dust Storm during June 2020. Visualization of the Godzilla Dust Storm during June 2020. This sequence observes the dust storm from West Africa. In June 2020, a s Earth Observing System Data and Information System (EOSDIS).The rest of this webpage offers visual content in layers. Frames of Earth imagery of the Godzilla Dust Storm visualization. Images are provided with transparency. This set of frames provides the dates layer. Frames are provided with transparency. Frames of the Earth layer for the Godzilla Dust Storm visualization, as seen from West Africa. Frames are provided with transparency. This set of frames provides the dates layer for the visualization sequence of the Godzilla Dust Storm, as seen from West Africa. Frames are provided with transparency.
Radiative Forcing
March 25, 2021, 6 a.m.
Read moreWe now have the first continuous, near-real-time observations of how humans are increasing Earth’s greenhouse effect, developed by NASA and university partners. The research directly demonstrates how human activities are responsible for changing the climate. A simplified animation of Earth t absorbed by Earth because it is reflected by the atmosphere, particles, and clouds, or light colored surfaces. Some heat heading to space is trapped by clouds and the atmosphere and gets re-radiated back down — the greenhouse effect — causing more warming. This study filters out variations in Earth’s energy budget due to feedback processes to show changes from aerosols (reflective particles in the atmosphere) and increases in the greenhouse effect caused by emissions of gases like carbon dioxide — the energy changes caused by humans.
27-year Sea Level Rise - TOPEX/JASON
Nov. 5, 2020, 5 a.m.
Read moreSea surface height change from 1992 to 2019, with colorbar This visualization shows total sea level change between 1992 and 2019, based on data collected from the TOPEX/Poseidon, Jason-1, Jason-2, and Jason-3 satellites. Blue regions are where sea level has gone down, and orange/red regions are where sea level has gone up. Since 1992, seas around the world have risen an average of nearly 6 inches. The color range for this visualization is -15 cm to +15 cm (-5.9 inches to +5.9 inches), though measured data extends above and below 15 cm (5.9 inches). This particular range was chosen to highlight variations in sea level change. Sea surface height change from 1992 to 2019, no colorbar Sea surface height change in the Pacific region from 1992 to 2019, with colorbar Sea surface height change in the Pacific region from 1992 to 2019, no colorbar Sea surface height change from 1992 to 2019, with colorbar, flat projection Sea surface height change from 1992 to 2019, no colorbar, flat projection Colorbar
NOAA-20 satellite orbit with Suomi NPP and JPSS-2
May 8, 2020, 2 a.m.
Read moreThis short visualization shows the orbit of NOAA-20 along with Suomi NPP. The camera rotates to a view perpendicular to the orbit plan, showing the half-orbit separation between the two satellites. The Joint Polar Satellite System (JPSS) is the nation’s advanced series of polar-orbiting environmental satellites. JPSS satellites circle the Earth from pole-to-pole and cross the equator 14 times daily in the afternoon orbit—providing full global coverage twice a day. Polar satellites are considered the backbone of the global observing system.The operational JPSS constellation currently consists of the NASA-NOAA Suomi National Polar-Orbiting Partnership satellite, the technology pathfinder mission for JPSS launched in 2011, and NOAA-20, previously called JPSS-1 and launched in 2017. The next satellite in the series, JPSS-2, is scheduled to launch in the first quarter of 2022. Once it is accepted into the constellation post-launch, JPSS-2 will be renamed NOAA-21 and replace Suomi-NPP. JPSS represents significant technological and scientific advancements in observations used for severe weather prediction and environmental monitoring. These data are critical to the timeliness and accuracy of forecasts three to seven days in advance of a severe weather event. JPSS is a collaborative effort between NOAA and NASA. This short visualization shows the orbit of NOAA-20 along with Suomi NPP. The camera rotates to a view perpendicular to the orbit plan, showing the half-orbit separation between the two satellites.
Earth: A System of Systems (updated)
May 7, 2020, 8 p.m.
Read moreAll six time-synchronous datasets, individually and then layered two at a time In order to study the Earth as a whole system and understand how it is changing, NASA develops and supports a large number of Earth-observing missions. These missions provide Earth science researchers the necessary data to address key questions about global climate change.This visualization reveals that the Earth system, like the human body, comprises diverse components that interact in complex ways. Shown first, the Multi-Scale Ultra-High Resolution (MUR) sea surface temperature (SST) dataset combines data from the Advanced Very High-Resolution Radiometer (AVHRR), Moderate Imaging Spectroradiometer (MODIS) Terra and Aqua, and Advanced Microwave Spectroradiometer-EOS (AMSR-E) instruments. Constantly released into the Earth’s atmosphere, heat and moisture from the ocean and land influence Earth’s weather patterns—represented here as wind speeds from the Modern-Era Retrospective analysis for Research and Applications (MERRA) dataset. Moisture in the atmosphere—represented as water vapor (also from MERRA)—forms clouds (shown here using cloud layer data from the NOAA Climate Prediction Center) and precipitation. Precipitation (data from GPM IMERG) significantly impacts water availability, which influences soil moisture (data from NASA-USDA-FA) and ocean salinity.While scientists learn a great deal from studying each of these components individually, improved observational and computational capabilities increasingly allow them to study the interactions between these interrelated geophysical and biological parameters, leading to unprecedented insight into how the Earth system works—and how it might change in the future.
Global Vegetation Index, Terra MODIS
Dec. 1, 2019, 7 p.m.
Read more16-day Terra/MODIS vegetation index maps beginning February 2000. One of the primary interests of NASA and tan areas show little or no growth. Black means no data. Monthly Terra/MODIS vegetation index maps beginning February 2000.
Active Fires As Observed by VIIRS, 2012-2018
July 18, 2019, 8 p.m.
Read moreGlobal Fires, 2012-2018 This visualization shows active fires as observed by the Visible Infrared Imaging Radiometer Suite, or VIIRS, from 2012 to 2018. The VIIRS instrument flies on the Joint Polar Satellite System’s Suomi-NPP and NOAA-20 polar-orbiting satellites. Instruments on polar orbiting satellites typically observe a wildfire at a given location a few times a day as they orbit the Earth from pole to pole. VIIRS detects hot spots at a resolution of 375 meters per pixel, which means it can detect smaller, lower temperature fires than other fire-observing satellites. Its observations are about three times more detailed than those from the MODIS instrument, for example. VIIRS also provides nighttime fire detection capabilities through its Day-Night Band, which can measure low-intensity visible light emitted by small and fledgling fires.This visualization uses a moving five-day average of measured brightness temperature to present a qualitative view of fire intensities around the globe. Global Fires, No Dates 2012-2018 Global Fires, Dates Only Global Fires, Spherical Global Fires, Hyperwall Size
Visualization Elements for Global Freshwater Campaign
May 22, 2019, 8 p.m.
Read moreSMAP/IMERG The following visualizations and animations were created in support of the video release entry ID 13227, for use as elements within the video. GRACE Seasonal ice, MODIS/Blue Marble Seasonal ice India Southern Africa full Southern Africa soil moisture rank data Southern Africa no data Southern Africa March-May 2019 seasonal anomaly SMAP surface soil moisture + IMERG, Africa SMAP surface soil moisture + IMERG, Western United States GRACE anomaly SMAP surface soil moisture IMERG precipitation rate Soil moisture rank colorbar Seasonal anomaly colorbar
Blue Marble 2015
April 4, 2016, 8 p.m.
Read moreThe Blue Marble, October 2015 Satellites like Suomi National Polar-orbiting Partnership (NPP) get a complete view of our planet each day, which allows us to create beautiful images of Earth like the one shown here. While it might seem simple, it is actually a rather complex process. Multiple, adjacent swaths of satellite data are pieced together like a quilt to make one global image. Suomi NPP was placed in a unique polar-orbit around the planet that takes the satellite over the equator at the same local (ground) time every orbit. The satellite passes are generally separated by 90 minutes and the instruments image the Earth’s surface in long wedges, called swaths. The swaths from each successive orbit overlap one another, so that at the end of the day, the satellite has a complete view of the world. This composite image, captured by Suomi NPP’s Visible Infrared Imaging Radiometer Suite (VIIRS), shows how the Earth looked from space on October 14, 2015—a day the contiguous United States had mostly clear skies. The movement of clouds is not easily visible between consecutive swaths of data; however, by the end of the day, the cumulative movement of clouds can be seen at the vertical seam located near the center of the Pacific Ocean. The vertical lines of haze near the equator are caused by sunglint, the reflection of sunlight off the ocean. The Blue Marble, October 2015, Slow Flat map texture
Sea Surface Temperature and Temperature Anomaly 2015-2016
Jan. 31, 2016, 7 p.m.
Read moreSea Surface Temperature compared to Sea Surface Temperature Anomaly El Niño is characterized by unusually warm ocean temperatures in the eastern equatorial Pacific. Sea surface temperature is the temperature of the top millimeter of the ocean s surface. A sea surface temperature anomaly (SSTA) represents how different the ocean temperature, at a particular location and time, is from the normal (or average) temperature for that place and time. These maps, showing sea surface temperature and sea surface temperature anomalies, reveal the progression of the strong 2015-16 El Nino event from January 1, 2015 to January 2, 2016. The sea surface temperature data are seven-day averages calculated using daily thermal data from the Moderate Resolution Imaging Spectroradiometer (MODIS) instrument. Missing data have been filled with monthly-average data. The sea surface temperature anomaly data are seven-day averages calculated using the 5-kilometer Coral Reef Watch product produced by the National Oceanic and Atmospheric Administration. The data are based on observations from geostationary and polar-orbiting satellites. A perspective view of SST and SSTA centered on the Pacific
Perpetual Ocean
Aug. 14, 2011, 8 p.m.
Read morePerpetual Ocean is a visualization of some of the world , labels, narration, or soundtrack from Perpetual Ocean.
Mars Methane Spectroscopy
Jan. 14, 2009, 7 p.m.
Read moreConceptual animation demonstrating the process of spectroscopy. The first animation demonstrates the general concept of visible-light spectroscopy by which white light is separated into its component wavelengths (colors) using a prism. The second animation demonstrates how this idea is applied to the discovery of methane in Mars that can be seen as missing lines on the resulting spectograph.