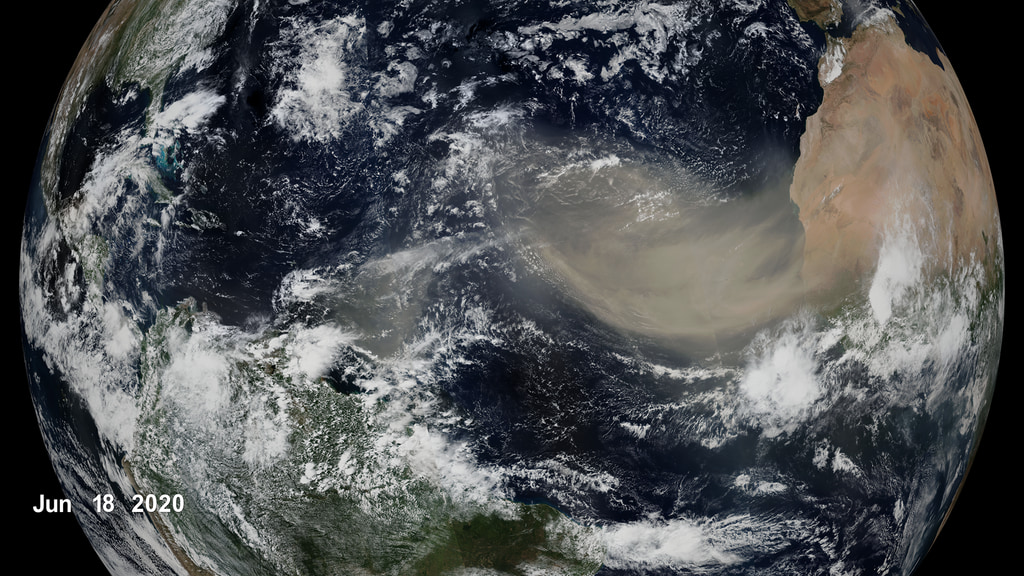
Warmer Ocean Temperatures May Decrease Saharan Dust Crossing the Atlantic
- Written by:
- Lara Streiff
- Produced by:
- Kathryn Mersmann
- View full credits
As the climate changes, dust activity will continue to be affected. In a new study, NASA researchers predict that within the next century we will see dust transport approach a 20,000-year minimum.
Movies
- 13839_AfricanDust_Final.webm (960x540)
- TWITTER_720_13839_AfricanDust_Final_twitter_720.mp4 (1280x720)
- YOUTUBE_1080_13839_AfricanDust_Final_youtube_1080.mp4 (1920x1080)
- 13839_AfricanDust_Final.mp4 (1920x1080)
Images
- Thumbnail_print.jpg (1024x574)
- Thumbnail.png (3056x1716)
- Thumbnail_thm.png (80x40)
- Thumbnail_searchweb.png (320x180)
Right click movies to download them if they automatically play in your browser.
Music: Dawn Drone by Juan Jose Alba Gomez [SGAE]
Complete transcript available.
Credits
Please give credit for this item to:
NASA's Goddard Space Flight Center
Visualizers
- Helen-Nicole Kostis (USRA)
- Kel Elkins (USRA)
Writer
- Lara Streiff (GSFC Interns) [Lead]
Producers
- Kathryn Mersmann (KBRwyle) [Lead]
- Lara Streiff (GSFC Interns)
Narrator
- Lara Streiff (GSFC Interns)
Series
This visualization can be found in the following series:Related pages
Celebrate Earth Day with NASA’s World-Wide View of Our Changing Climate Live Shots
April 19, 2021, 5 p.m.
Read moreQuick link to associated BROLL for the live shots.Quick link to canned interview with Dr. Gavin SchmidtQuick link to canned interview in Spanish with Erika Podest Most people know NASA as the forefront of space exploration, from landing robots on Mars to sending humans into space. But did you know that one of NASA’s biggest fields of study is planet Earth? Studying Earth’s land, sea and air not only refines the spacecraft that we send to space, it also tells us an incredible amount about our home planet. From the International Space Station to NASA’s Earth observing satellites, NASA instruments create a continuous data record that track global changes over time. Coupled with observations from the air, sea and land, these records are used across the globe in myriad ways, from improving the planting of crops to understanding the impacts of sea level rise. NASA experts are available virtually for live or taped interviews on Thursday, April 22 from 8:00 a.m. to 1:00 p.m. EDT to share with your viewers how they can celebrate with NASA’s Earth Day activities and explain NASA’s role in studying Earth. To Schedule an interview: Please fill out this form**: https://forms.gle/Zv5Ximf2bpHf7pAk8**Please note: requests received after 5:00 p.m. EDT on Wednesday, April 21 may not be accommodated.Interviews will be conducted using video chat programs including Zoom and Skype, in 15-minute slots. For example 600-615 ET, 615-630 EDT, etc. Our preferred program is Zoom and stations will have to send us a Zoom link to use. Satellite interviews are not available. Please do not use an IFB unless necessary.*Spanish Interviews are available*Participating Scientists/Engineers:Karen St. Germain, Earth Science Division DirectorDouglas Terrier, Chief TechnologistDoug Morton, Chief of the Biospheric Sciences LaboratoryLiz Hoy, Senior Support ScientistLesley Ott, Climate ScientistJohn Bolten, Physical Research ScientistIvona Cetinić, OceanographerRachel Tilling, Research ScientistDenis Felikson, Research ScientistMatt Rodell, Acting Deputy Director of Earth Sciences for Hydrosphere, Biosphere, and GeophysicsBridget Seegers, Research ScientistSandra Cauffman, Deputy Director, Earth Science Division [Interviews in Spanish]Alfonso Delgado-Bonal, Associate Scientist [Interviews in Spanish]Erika Podest, Scientist [Interviews in Spanish]Suggested Questions:1. When most people think of NASA, they might think of space exploration. What is NASA’s connection to Earth Day?2. NASA will launch a crew to the International Space Station tomorrow morning. What are some of the missions and instruments on the International Space Station that benefit Earth?3. Climate change is one of the major issues of our generation. What has studying Earth from space taught us about climate change?4. How does climate change impact* [*Please select the question that you believe will hold the most interest for your viewers.]Hurricane trends after the record-breaking 30 named storms last year? Wildfires?Sea level rise?Floods and droughts?General weather trends that impact viewers all over the country?5. One of NASA’s longest running Earth science missions, Landsat, is launching a new satellite later this year. Can you tell us a little bit more about this mission?6. Where can people learn more about NASA Earth Day activities? Longer Interview Questions:1. NASA also observes Earth from a bit closer to the ground. Can you talk about some of your field and airborne campaigns?2. NASA has started a recent “Grow to Launch” campaign. What is that campaign and how can people get involved?Suggested Anchor Intro: “WHEN YOU THINK OF NASA, YOU MIGHT THINK OF ROCKETS LAUNCHING TO ANOTHER PLANET AND HUMANS WALKING ON THE MOON. BUT NASA ACTUALLY HAS A VARIETY OF MISSIONS THAT FOCUS ON STUDYING CHANGES ON EARTH, FROM SEA LEVEL RISE TO HURRICANES. HERE TO CELEBRATE EARTH DAY WITH US IS NASA….” Canned interview with Dr. Gavin Schmidt, acting NASA Senior Climate Advisor. TRT 6:12 Canned interview in Spanish with Erika Podest. TRT 7:15 For More InformationSee [https://earthobservatory.nasa.gov/features/videos/window-on-the-world](https://earthobservatory.nasa.gov/features/videos/window-on-the-world)
Godzilla Dust Storm
April 19, 2021, 5:30 a.m.
Read moreVisualization of the Godzilla Dust Storm during June 2020. Visualization of the Godzilla Dust Storm during June 2020. This sequence observes the dust storm from West Africa. In June 2020, a s Earth Observing System Data and Information System (EOSDIS).The rest of this webpage offers visual content in layers. Frames of Earth imagery of the Godzilla Dust Storm visualization. Images are provided with transparency. This set of frames provides the dates layer. Frames are provided with transparency. Frames of the Earth layer for the Godzilla Dust Storm visualization, as seen from West Africa. Frames are provided with transparency. This set of frames provides the dates layer for the visualization sequence of the Godzilla Dust Storm, as seen from West Africa. Frames are provided with transparency. For More InformationSee [NASA.gov](https://www.nasa.gov/feature/esnt/2021/nasa-study-predicts-less-saharan-dust-in-future-winds)
Historical Atlantic Multidecadal Oscillation (AMO)
April 19, 2021, 5:30 a.m.
Read moreVisualization of Sea Surface Temperature (SST) Anomaly with corresponding timeplot tracking the Atlantic Multidecadal Oscillation (AMO) Index over the North Atlantic (0-80N) for the period of 1900-2005. Atlantic Multidecadal Oscillation (AMO) Smooth Index for the period 1861-2015. The still image is provided with transparency. Data Sources:Atlantic Mutlidecadal Oscillation (AMO) Index. The AMO Index is a monthly index of the North Atlantic temperatures from 1856 to present. This data visualization utilized the smoothed, long version of the AMO index. The data is available here: https://psl.noaa.gov/data/timeseries/AMO/Extended Reconstructed Sea Surface Temperature (ERSST) v5 (global monthly dataset). Data Citation: Boyin Huang, Peter W. Thorne, Viva F. Banzon, Tim Boyer, Gennady Chepurin, Jay H. Lawrimore, Matthew J. Menne, Thomas M. Smith, Russell S. Vose, and Huai-Min Zhang (2017): NOAA Extended Reconstructed Sea Surface Temperature (ERSST), Version 5. [Subset used: 1854-2020]. NOAA National Centers for Environmental Information. doi: 10.7289/V5T72FNM. [access date: February 2020]. For the purposes of this visualization the science team derived Sea Surface Temperature Anomaly (from ERSST v5) for the North Atlantic region (0-80N) for the period 1900-2005.Blue Marble: Next Generation was produced by Reto Stöckli, NASA Earth Observatory (NASA Goddard Space Flight Center). Citation: Reto Stöckli, Eric Vermote, Nazmi Saleous, Robert Simmon and David Herring. The Blue Marble Next Generation – A true color earth dataset including seasonal dynamics from MODIS, October 17, 2005.Global 30 Arc-Second Elevation (GTOPO 30) from USGS. doi: 10.5066/F7DF6PQSThe rest of this webpage offers additional versions, frames, layers and colorbar information, associated with the development of this data-driven visualization. Visualization of historical Sea Surface Temperature (SST) Anomaly for the period 1900-2005. The gray inset highlights the Atlantic Multidecadal Oscillation (AMO) region over the North Atlantic with extents 0-80N. Frames of Sea Surface Temperature (SST) Anomaly averaged for the period 1900-2005. The gray inset indicates the Atlantic Multidecadal Oscillation (AMO) Region in the North Atlantic, with extents 0-80N. This set of frames serves as a layer and is provided with transparency. This set of frames provides the dates layer. Frames are provided with transparency. This set of frames provides the animated timeplot for the period 1900-2005. The timeplot visualizes the smoothed Atlantic Multidecadal Oscillation (AMO) Index over the region in the North Atlantic with extents 0-80N. Frames include the labels of Cool and Warm Phases to highlight the pattern and duration of events during the period 1900-2005. Frames are provided with transparency. Title of the visualization sequence. The still image is provided with transparency. Atlantic Multidecadal Oscillation (AMO) Smooth Index for the period 1861-2015. The still image is provided with transparency. For More InformationSee [NASA.gov](https://www.nasa.gov/feature/esnt/2021/nasa-study-predicts-less-saharan-dust-in-future-winds)
Dust Reduction - Intertropical Convergence Zone (ITCZ) Movement
April 19, 2021, 5:30 a.m.
Read moreThis visualization depicts the northern trend of the Intertropical Convergence Zone (ITCZ). A horizontal black line indicates the current ITCZ centroid for the longitudinal extents of the study region, which moves with GPCP precipitation data. The northernmost extent of the ITCZ is indicated with a thin white line for each year. The bold white line represents the northernmost overall extent. The grey box represents the study region used to calculate the ITCZ centroid. A region of dust optical depth data is shown in orange off the coast of Africa. Data Sources:Global Precipitation Climatology Project (GPCP) - monthly precipitation dataset from 1979-present combines observations and satellite precipitation data into 2.5°x2.5° global grids. GPCP Precipitation data provided by the NOAA/OAR/ESRL PSL, Boulder, Colorado, USA, from their Web site hereDust Optical Depth. Evan, A.T. and Mukhopadhyay, S., 2010. African dust over the northern tropical Atlantic: 1955–2008. Journal of Applied Meteorology and Climatology, 49(11), pp.2213-2229. This visualization depicts the northern trend of the Intertropical Convergence Zone (ITCZ). A horizontal black line indicates the current ITCZ centroid for the longitudinal extents of the study region, which moves with GPCP precipitation data. The northernmost extent of the ITCZ is indicated with a thin white line for each year. The bold white line represents the northernmost overall extent. The grey box represents the study region used to calculate the ITCZ centroid.
Grand Average Precipitation Climatology
Oct. 15, 2019, 8 p.m.
Read moreGrand Average Precipitation Climatology The Grand Average Climatology dataset covers June 2000 to May 2019. It shows the well-known structure of global precipitation: Intertropical Convergence Zone (ITCZ) near the Equator, South Pacific Convergence Zone (SPCZ) and smaller South Atlantic Convergence Zone (SACZ), relatively dry subtropical highs, and mid-latitude storm tracks. The relatively fine spatial resolution (0.1° lat./lon.) gives a more detailed picture than the previous NASA product (Tropical Rainfall Measuring Mission [TRMM] Multi-satellite Precipitation Analysis [TMPA], 0.25°), and its near-global coverage, better sampling in time, and improved algorithms provide wider coverage and more confidence in the results. The satellite input allows NASA researchers to estimate precipitation over both land and ocean, which networks of surface sensors do not provide. The most reliable estimates are provided over ocean; warm land is second-best, coastal areas are third, and snow/ice-covered regions are least certain. Colorbar for the IMERG Grand Average Climatology dataset. Cooler colors are areas that receive very little rain. Warm colors receive more rain. Alternative colorbar for the IMERG Grand Average Climatology with white outline and white text.