11 Years Charting The Edge of The Solar System
- Written by:
- Kathalina Tran
- Produced by:
- Joy Ng
- View full credits
Movies
- 13642_IBEX11years_YouTube.webm (1920x1080) [33.9 MB]
- 13642_IBEX11years_Facebook.mp4 (1920x1080) [366.4 MB]
- 13642_IBEX11years_Twitter.mp4 (1920x1080) [66.4 MB]
- 13642_IBEX11years_YouTube.mp4 (1920x1080) [489.0 MB]
- 13642_IBEX11years_Prores-2.mov (1920x1080) [4.2 GB]
Captions
- IBEX11years.en_US.srt [5.8 KB]
- IBEX11years.en_US.vtt [5.8 KB]
Images
- 13642_IBEX11years_YouTube.00214_print.jpg (1024x576) [239.3 KB]
- 13642_IBEX11years_YouTube.00214_thm.png (80x40) [6.7 KB]
- 13642_IBEX11years_YouTube.00214_searchweb.png (320x180) [98.0 KB]
Watch this video on the NASA Goddard YouTube channel.
Music credits: “End of Days - Joe Mason Remix” by Connor Shambrook [BMI], Cyrus Reynolds [BMI], Flynn Hase Spence [ASCAP], Joseph Scott Mason [APRA]; “Brainstorming” by Laurent Dury [SACEM]; “Flight of the Leaf Remix” by Julie Gruss [GEMA], Laurent Dury [SAXEM]; “Ticks and Thoughts” by Laurent Dury [SACEM]; “Intimate Journey” by Laurent Vernerey [SACEM], Nicolas de Ferran [SACEM] from Universal Production Music
Complete transcript available.
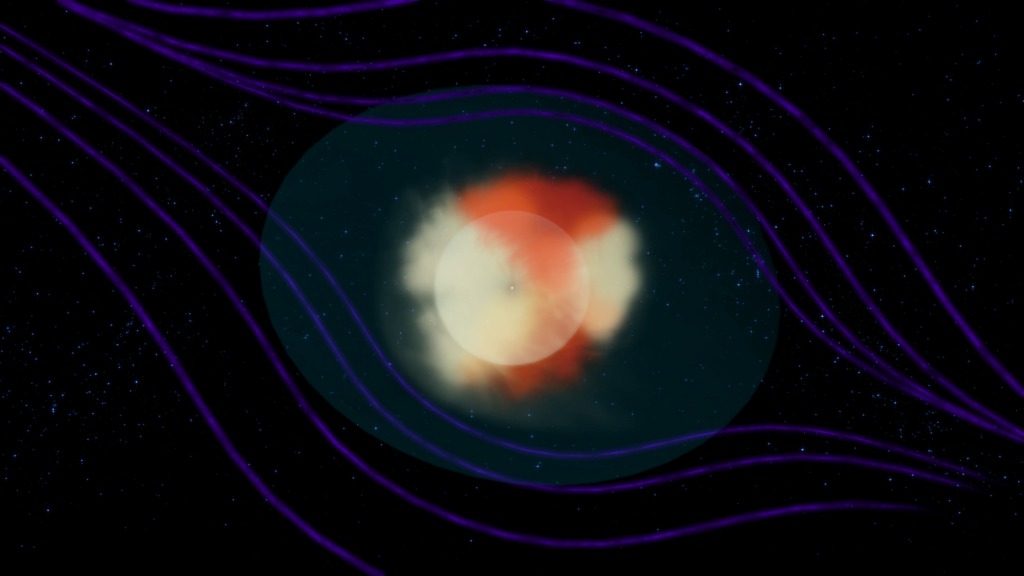
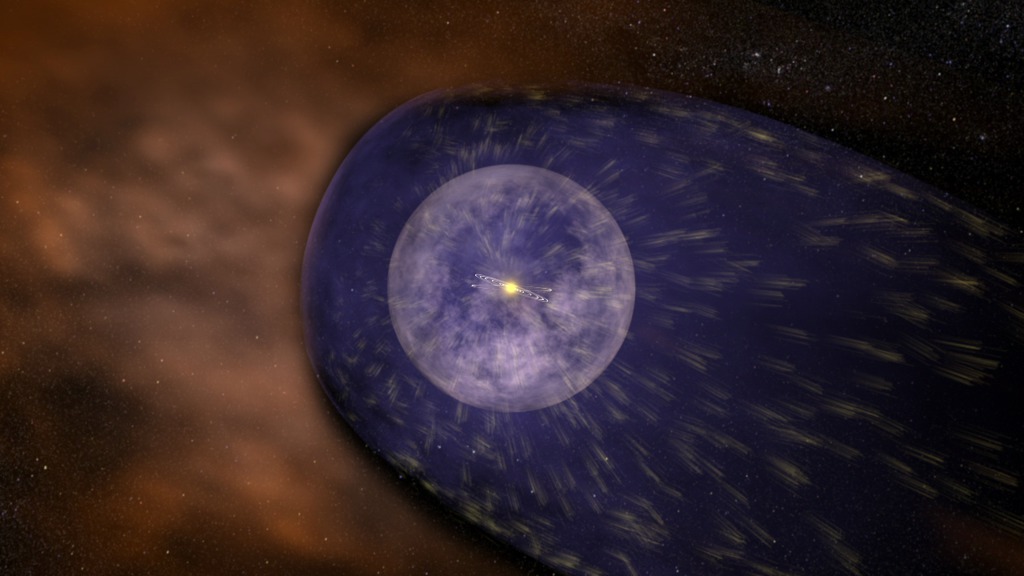
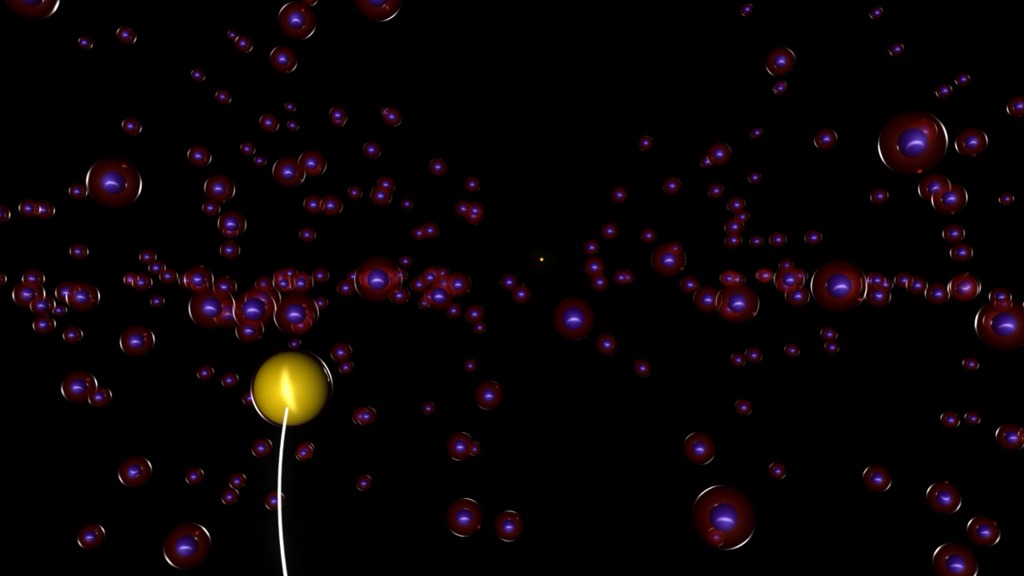
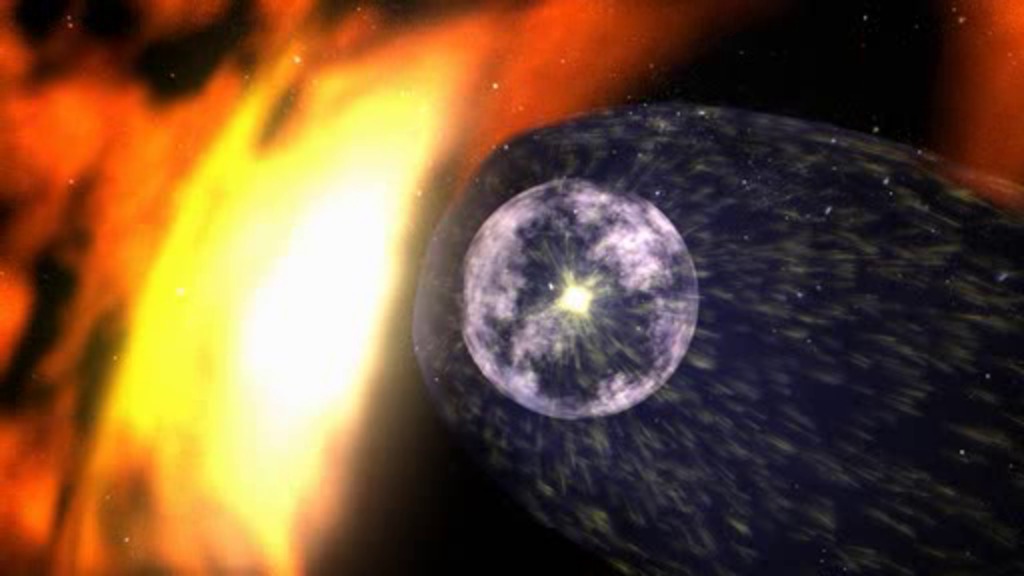
This is the heliosphere, the vast bubble that is generated by the Sun’s magnetic field and envelops all the planets. The borders of this cosmic bubble are not fixed. In response to the Sun’s gasps and sighs, they shrink and stretch over the years.
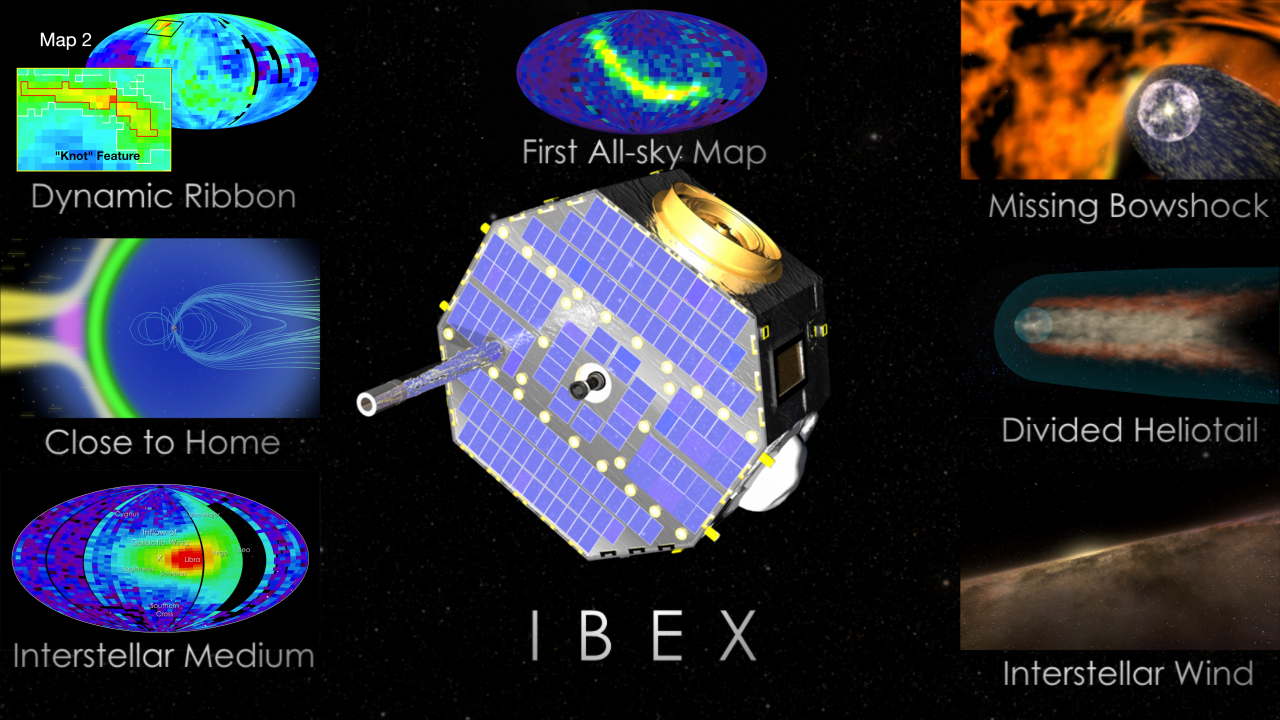
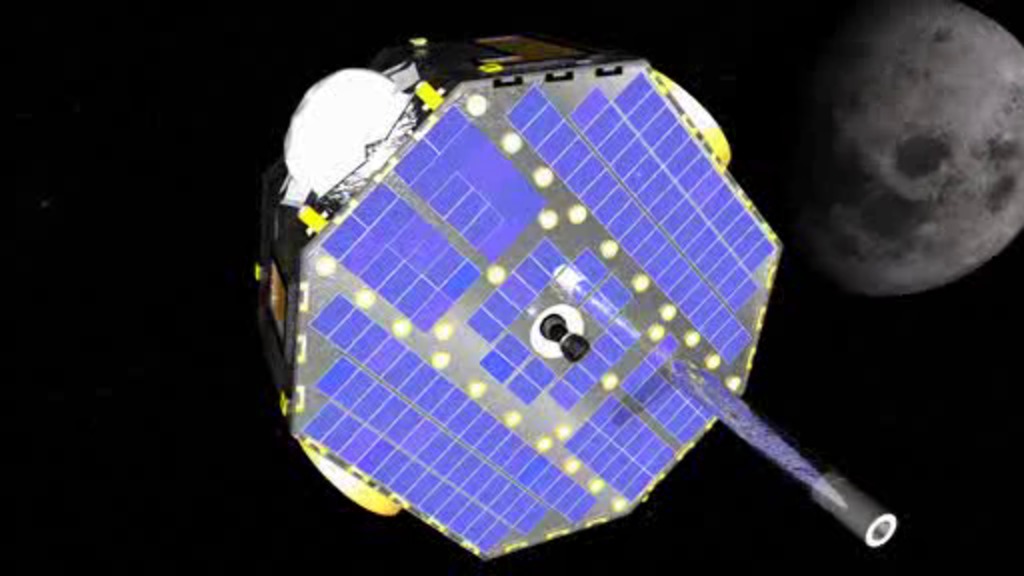
Now, for the first time, scientists have used an entire solar cycle of data from NASA’s IBEX spacecraft to study how the heliosphere changes over time. Solar cycles last roughly 11 years, as the Sun swings from seasons of high to low activity, and back to high again. With IBEX’s long record, scientists were eager to examine how the Sun’s mood swings play out at the edge of the heliosphere. The results show the shifting outer heliosphere in great detail, deftly sketch the heliosphere’s shape — a matter of debate in recent years, and hint at processes behind one of its most puzzling features. These findings, along with a newly fine-tuned data set, are published in The Astrophysical Journal Supplements on June 10, 2020.
Credits
Please give credit for this item to:
NASA's Goddard Space Flight Center. However, individual items should be credited as indicated above.
Animators
- Adriana Manrique Gutierrez (KBRwyle)
- Jonathan North (KBRwyle)
- Joy Ng (KBRwyle)
- Krystofer Kim (KBRwyle)
- Walt Feimer (KBRwyle)
Data visualizer
- Tom Bridgman (GST)
Writer
- Kathalina Tran (SGT) [Lead]
Scientists
- Dave McComas (SwRI)
- Eric Christian (NASA/HQ)
- Jamey Szalay (Princeton University)
Producer
- Joy Ng (KBRwyle) [Lead]
Narrator
- Joy Ng (KBRwyle)
Papers
This visualization is based on the following papers:- https://iopscience.iop.org/article/10.3847/1538-4365/ab8dc2
Missions
This visualization is related to the following missions:Series
This visualization can be found in the following series:Related pages
The Heliosphere Has Ripples!
Feb. 17th, 2023
Read moreWatch this video on the NASA Solar System Exploration Instagram page.Complete transcript available.Music credits: “Peaks and Spikes [Instrumental]” by Max van Thun [GEMA] A version of this video with no on-screen text
Five Years of Great Discoveries for NASA's IBEX
Oct. 30th, 2013
Read moreShort narrated video.Watch this video on the NASAexplorer YouTube channel.For complete transcript, click here. Alternate still image. Launched on Oct. 19, 2008, the Interstellar Boundary Explorer, or IBEX, spacecraft, is unique to NASA's heliophysics fleet: it images the outer boundary of the heliosphere, a boundary at the furthest edges of the solar system, far past the planets, some 8 million miles away. There, the constant stream of solar particles flowing off the sun, the solar wind, pushes up against the interstellar material flowing in from the local galactic neighborhood.IBEX is also different because it creates images from particles instead of light. IBEX, scientists create maps from the observed neutral atoms. Some are of non-solar origin, others were created by collisions of solar wind particles with other neutral atoms far from the sun. Observing where these energetic neutral atoms, or ENAs, come from describes what's going on in these distant regions. Over the course of six months and many orbits around Earth, IBEX can paint a picture of the entire sky in ENAs.During its first five years, IBEX has made some astounding discoveries.IBEX is a NASA Heliophysics Small Explorer mission. The Southwest Research Institute in San Antonio, Texas, leads IBEX with teams of national and international partners. NASA's Goddard Space Flight Center in Greenbelt, Md., manages the Explorers Program for the agency's Science Mission Directorate in Washington. For More InformationSee [http://www.nasa.gov/content/goddard/five-years-of-great-discoveries-for-nasas-ibex/](http://www.nasa.gov/content/goddard/five-years-of-great-discoveries-for-nasas-ibex/) Related pages
IBEX: Observing the Sun's Horizon
May 10th, 2012
Read moreShort narrated video about the Interstellar Boundary Explorer spacecraft and mission.For complete transcript, click here. The Interstellar Boundary Explorer, or IBEX, is the first mission designed to map the entire region of the boundary of our Solar System. As charged particles from the Sun, called the "solar wind," flow outward well beyond the orbits of the planets, they collide with the material between the stars, called the "interstellar medium" (ISM). These interactions create energetic neutral atoms (ENAs), particles with no charge that move very quickly. This region emits no light that can be collected by conventional telescopes so, instead, IBEX measures the particles that happen to be traveling inward from the boundary. IBEX contains two detectors designed to collect and measure ENAs, providing data about the mass, location, direction of origin, and energy of these particles. From these data, maps of the boundary are created. IBEX's sole, focused science objective is to discover the nature of the interactions between the solar wind and the interstellar medium at the edge of our Solar System. Related pages
NASA's IBEX Spacecraft Reveals New Observations of Interstellar Matter
Jan. 31st, 2012
Read moreShort, narrated video about IBEX's interstellar matter observations.For complete transcript, click here. Our heliosphere is the region of space dominated by the Sun and is inflated, like a bubble, in local interstellar material by the million mile-per-hour solar wind. This bubble keeps out the ionized or charged particles and magnetic fields from the galaxy and so protects us from dangerous Galactic Cosmic Rays. Credit: SwRI A face-on view of our Milky Way Galaxy begins the animation. The Milky Way Galaxy is organized into spiral arms of giant stars that illuminate interstellar gas and dust. The Sun is in a finger called the Orion Spur. A zoom to the cluster of tenuous interstellar clouds close to the Sun reveals the cloud motions. The final zoom revealsthat the Sun will soon emerge from the Local Cloud that now surrounds the Sun.Credit: NASA/Adler/U. Chicago/Wesleyan/JPL-Caltech The Orion nebula is a stellar nursery. Giant interstellar clouds cradle massive young stars that are only a few hundred thousands years old. The brilliant whitish core is illuminated by the young Trapezium stars. Remnants of the star-forming dust cocoon are seen as dark lanes against a bright adjacent nebula. Towards the right of the region, interstellar gas and dust have been blown into giant arcs and bubbles by strong stellar winds. Giant bubbles of interstellar gas, formed from stellar winds and supernovae, are found throughout space,including close to the Sun.Credit: NASA/Hubble Located in the constellation of Taurus, the Crab nebula is the remnant of a supernova formed from the explosion of a massive star a thousand years ago in 1054. Most elements on Earth are produced by supernova explosions. About thirty elements in the periodic chart have been detected in the interstellar medium. Supernova such as the Crab have produced the interstellar oxygen and neon atoms that are observed by IBEX.Credit: NASA/ESA If we had the privilege to look up at the sky far away from the Sun using Giordi LaForge's visor we would see the interstellar wind "beckoning" at us as a bright spotlight from the direction of Scorpio. Shown are Sagittarius, Scorpio, and Libra, as seen, for example, when looking south at midnight in June, with the interstellar wind above Scorpio. Animation, zooming out from Scorpio to a full sky view of the stars. It blends over to a color-coded full sky neutral atom map, as obtained with IBEX at energies where the interstellar wind is the brightest feature in the maps. In Earth's orbit, where IBEX makes its observations, the maximum flow (in red) is seen to arrive from Libra instead of Scorpio because the interstellar wind is forced to curve around the Sun by gravity. Credit: NASA/GSFC/UNH Still from previous visualization: color-coded full sky neutral atom map, as obtained with IBEX at energies where the interstellar wind is the brightest feature in the maps. In Earth's orbit, where IBEX makes its observations, the maximum flow (in red) is seen to arrive from Libra instead of Scorpio because the interstellar wind is forced to curve around the Sun by gravity. Credit: NASA/GSFC/UNH Pictorial view of the Earth's orbit and the interstellar flow, as seen from far above the North Pole. During its journey through the Sun's gravitation, the wind is bent like a soccer ball that is pulled back to Earth in a curve. Slower wind (dark blue) is bent stronger than faster wind. Thus, IBEX observes slower wind earlier on Earth's orbit than faster wind, during the month of February when the Earth moves into the flow. To determine the flow speed, the IBEX team has taken advantage of this "speedometer" that Mother Nature provides to us for free. Credit: NASA/GSFC/UNH New interstellar speed and flow direction in longitude (red, Bzowski et al., ApJ Suppl., 2012; yellow, M?bius et al., APJ Suppl., 2012) in comparison with the previous result (blue, Witte, Astron. Astrophys., 2004) and astronomical observations of the nearby interstellar clouds (grey, Redfield & Linsky, ApJ, 2008). While the previous interstellar flow result seemed to fall between the two nearest clouds, the new result puts the solar system right into the local cloud. Credit: NASA/GSFC/UNH Animated view showing the neon to oxygen ratio in the neutral gas of the local cloud, as obtained with IBEX, in comparison with the ratio for the Sun and the Milky Way galaxy. There is much less oxygen in the gas of the local cloud, which presents an interesting puzzle to astronomers. Is a substantial portion of the essential ingredient for life (oxygen) locked up in interstellar dust, or does this tell us how different the conditions our immediate neighborhood are than at the birthplace of the Sun? The new IBEX measurements of the velocity of interstellar atoms definitively pinpoint the location of the Sun relative to the gas and dust in our immediate vicinity. On the left, the distribution of gas and dust around the Sun is shown, and the direction of motion of the various gas clouds are depicted by arrows. The nearest clouds are the Local Cloud and the G Cloud. On the right, the new results from IBEX solved a discrepancy and are a perfect match with the Local Cloud measurements made by looking at nearby stars. Now we know that the Sun is surrounded by the Local Cloud, while being very close to its edge.Credit: NASA/GSFC/Adler/U. Chicago/Wesleyan Alternate version The conditions necessary to make the heliosphere, namely the balance of an outward pushing stellar wind and the inward compression of surrounding interstellar gas is so common, that perhaps most stars have analogous structures, called astrospheres. Photographs of three such astrospheres are shown, as taken by various telescopes.Credit: NASA/ESA/JPL-Caltech/GSFC/SwRI Due to the protective shielding of dangerous Galactic Cosmic Rays provided by a heliosphere or astrosphere, these structures are important for the planets that orbit the respective stars. Only over the last 15 years, we have been able to detect the first astrospheres and planets around other stars (exoplanets). Here we show a zoom into the most immediate environment around the Sun, our cosmic neighborhood. The locations of known astrospheres and exoplanets are indicated, while we anticipate that many more are present and just awaiting discovery. The nearest star, alpha Centauri has an astrosphere, and we know of at least two cases where we have detected both an astrosphere and exoplanets. These systems are truly analogous to our system in which the heliosphere shields a diverse planetary system. Reformatted for TV.Credit: NASA/GSFC/Adler/U. Chicago/Wesleyan Due to the protective shielding of dangerous Galactic Cosmic Rays provided by a heliosphere or astrosphere, these structures are important for the planets that orbit the respective stars. Only over the last 15 years, we have been able to detect the first astrospheres and planets around other stars (exoplanets). Here we show a zoom into the most immediate environment around the Sun, our cosmic neighborhood. The locations of known astrospheres and exoplanets are indicated, while we anticipate that many more are present and just awaiting discovery. The nearest star, alpha Centauri has an astrosphere, and we know of at least two cases where we have detected both an astrosphere and exoplanets. These systems are truly analogous to our system in which the heliosphere shields a diverse planetary system. FULL IMAGE.Credit: NASA/Adler/U. Chicago/Wesleyan The solar journey through space is carrying us through a cluster of very low density interstellar clouds. Right now the Sun is inside of a cloud that is so tenuous that the interstellar gas detected by IBEX is as sparse as a handful of air stretched over a column that is hundreds of light years long. These clouds are identified by their motions. Labels.Credit: NASA/Adler/U. Chicago/Wesleyan The solar journey through space is carrying us through a cluster of very low density interstellar clouds. Right now the Sun is inside of a cloud that is so tenuous that the interstellar gas detected by IBEX is as sparse as a handful of air stretched over a column that is hundreds of light years long. These clouds are identified by their motions. No Labels.Credit: NASA/Adler/U. Chicago/Wesleyan Collage of images shown in the press conference.Credit: NASA/GSFC/Hubble/SwRI/CI Lab Alternate still showing the neon to oxygen ratio in the neutral gas of the local cloud, as obtained with IBEX, in comparison with the ratio for the Sun and the Milky Way galaxy. A great magnetic bubble surrounds the solar system as it cruises through the galaxy. The sun pumps the inside of the bubble full of solar particles that stream out to the edge until they collide with the material that fills the rest of the galaxy, at a complex boundary called the heliosheath. On the other side of the boundary, electrically charged particles from the galactic wind blow by, but rebound off the heliosheath, never to enter the solar system. Neutral particles, on the other hand, are a different story. They saunter across the boundary as if it weren't there, continuing on another 7.5 billion miles for 30 years until they get caught by the sun's gravity, and sling shot around the star. There, NASA's Interstellar Boundary Explorer lies in wait for them. Known as IBEX for short, this spacecraft methodically measures these samples of the mysterious neighborhood beyond our home. IBEX scans the entire sky once a year, and every February, its instruments point in the correct direction to intercept incoming neutral atoms. IBEX counted those atoms in 2009 and 2010 and has now captured the best and most complete glimpse of the material that lies so far outside our own system. The results? It's an alien environment out there: the material in that galactic wind doesn't look like the same stuff our solar system is made of.More than just helping to determine the distribution of elements in the galactic wind, these new measurements give clues about how and where our solar system formed, the forces that physically shape our solar system, and even the history of other stars in the Milky Way.In a series of science papers appearing in the Astrophysics Journal on January 31, 2012, scientists report that for every 20 neon atoms in the galactic wind, there are 74 oxygen atoms. In our own solar system, however, for every 20 neon atoms there are 111 oxygen atoms. That translates to more oxygen in any given slice of the solar system than in the local interstellar space. For media associated with this release, go to #10905 and #3900. For More InformationSee [http://www.nasa.gov/mission_pages/ibex/multimedia/013112-briefing-materials.html](http://www.nasa.gov/mission_pages/ibex/multimedia/013112-briefing-materials.html) Related pages
IBEX Spacecraft Finds Discoveries Close to Home
Feb. 7th, 2011
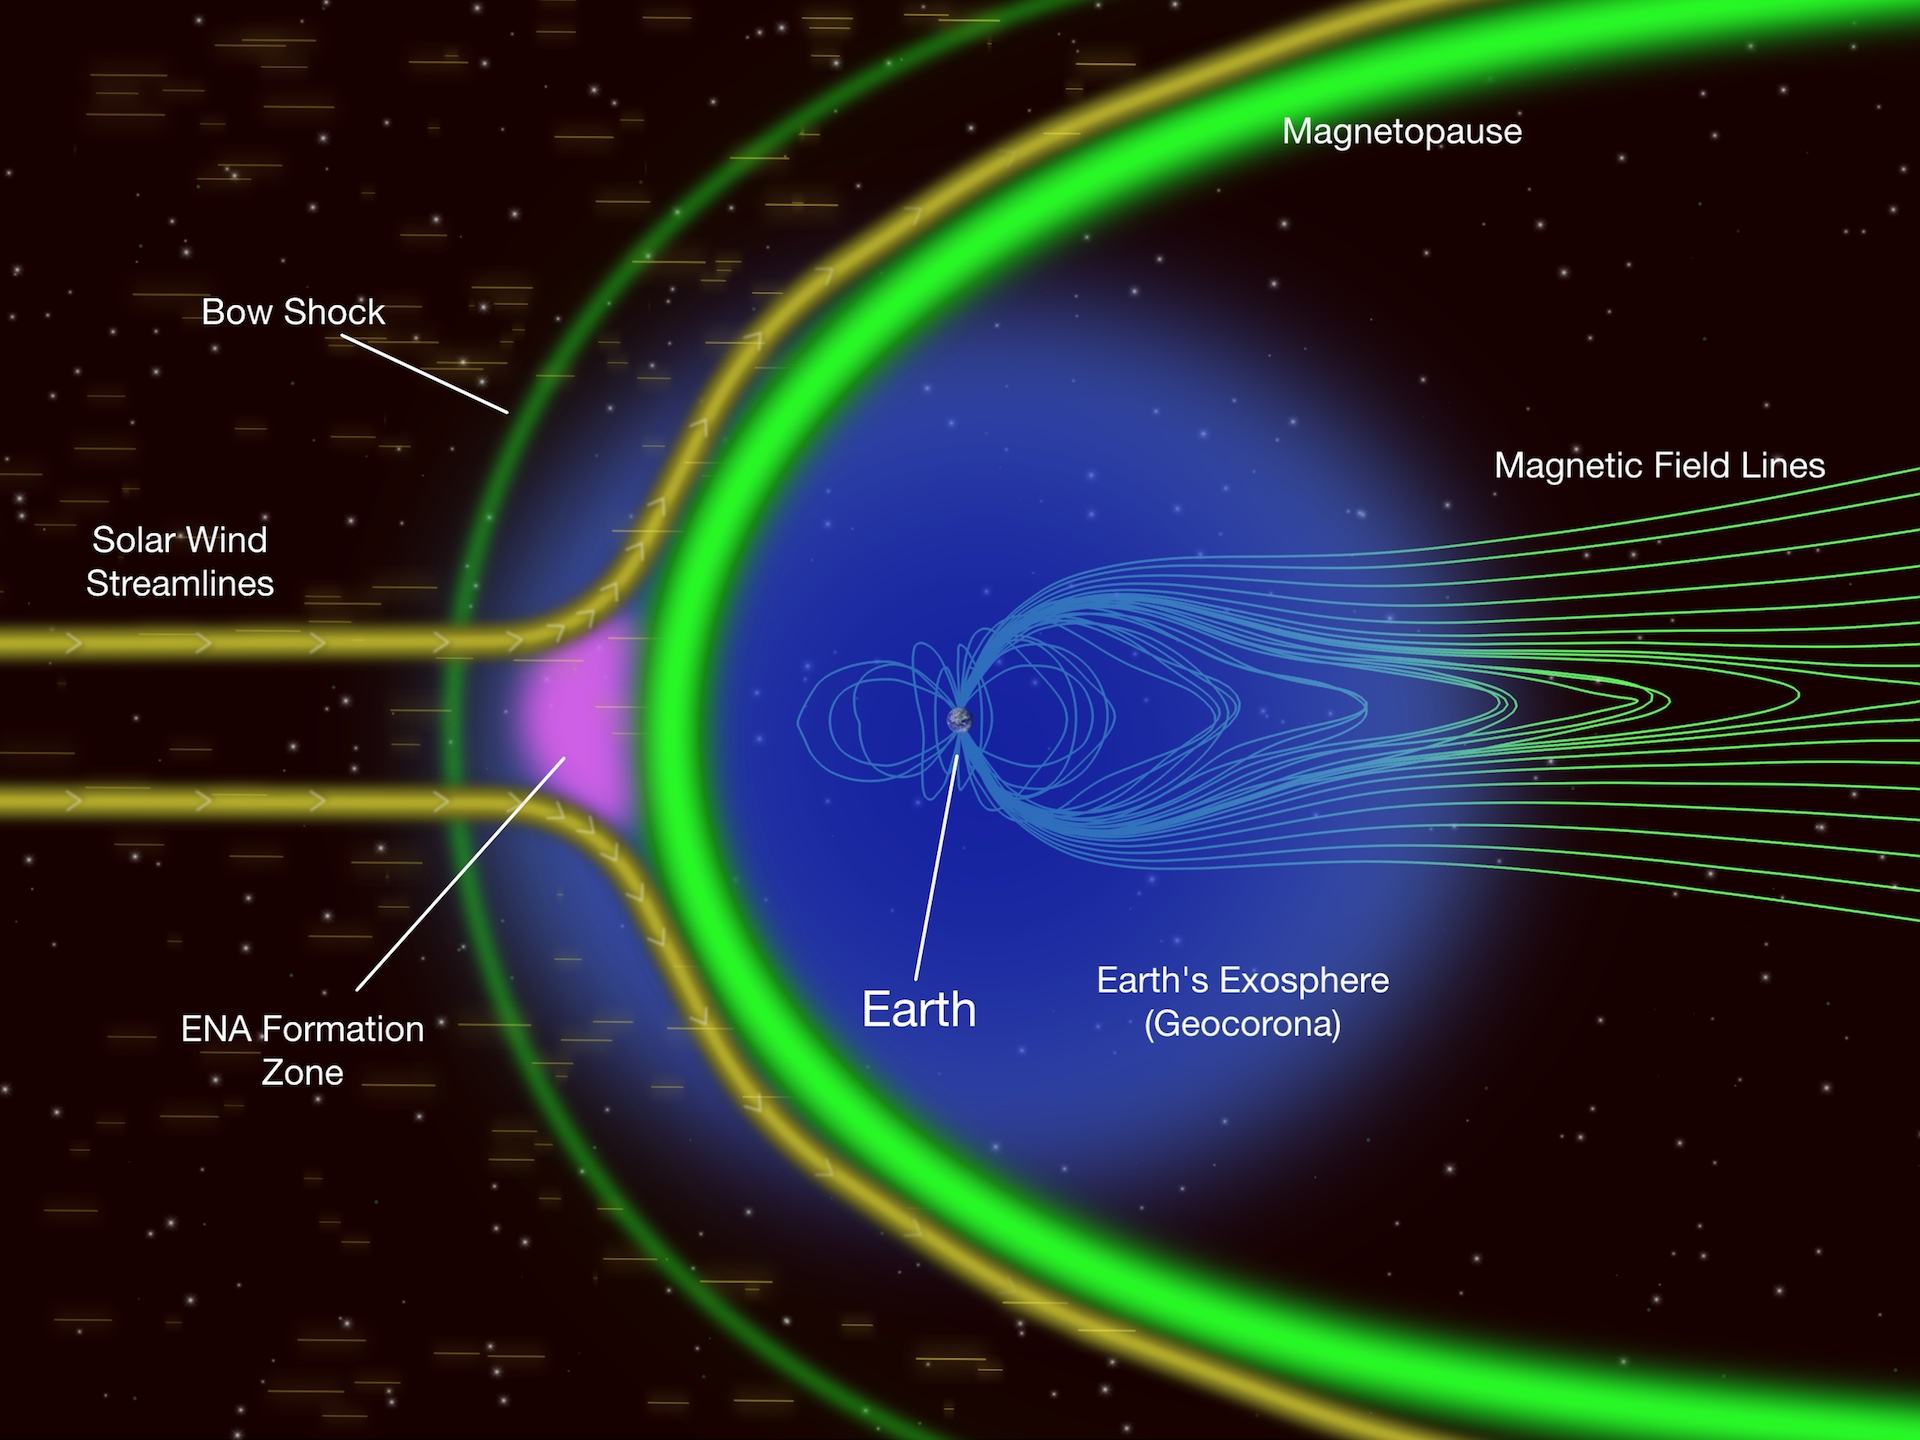
Read moreIllustration of important features and interaction region. IBEX found that Energetic Neutral Atoms, or ENAs, are coming from a region just outside Earth's magnetopause where nearly stationary protons from the solar wind interact with the tenuous cloud of hydrogen atoms in Earth's exosphere. For More InformationSee [http://www.nasa.gov/mission_pages/ibex/em-crash.html](http://www.nasa.gov/mission_pages/ibex/em-crash.html) Related pages
NASA Mission Shows Evolution of Conditions at Edge of Solar System
Sept. 30th, 2010
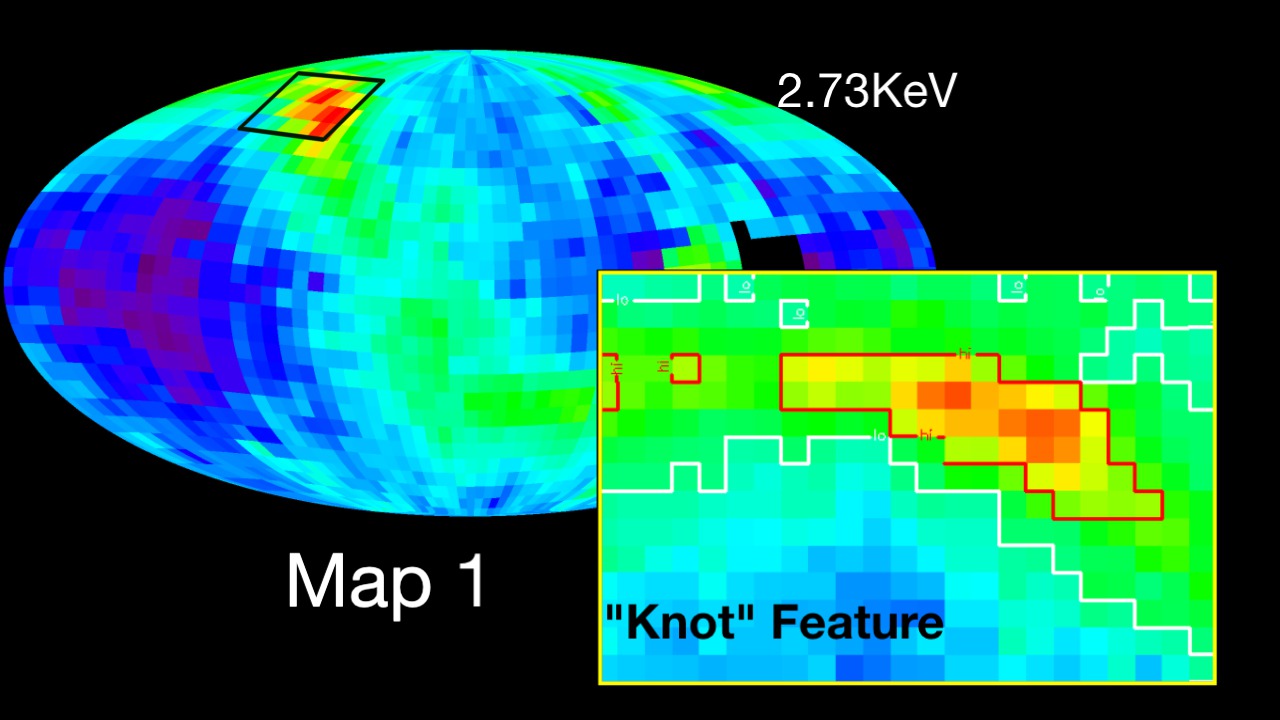
Read moreThe IBEX science team compares the first and second maps to reveal whether there are time variations in the Ribbon or the more distributed emissions around the ribbon. This animation fades between the first and second IBEX maps. We see that the first and second maps are relatively similar. However, there are significant time variations as well. These time variations are forcing scientists to try to understand how the heliosphere can be changing so rapidly. One of the clear features visible in the IBEX maps is an apparent knot in the ribbon. Scientists were anxious to see how this structure would change with time. The second map showed that the knot in the ribbon somehow spread out. It is as if the knot in the ribbon was literally untangled over only 6 months. First map. One of the clear features visible in the IBEX maps is an apparent knot in the ribbon. Scientists were anxious to see how this structure would change with time. The second map showed that the knot in the ribbon somehow spread out. It is as if the knot in the ribbon was literally untangled over only 6 months. Second map. Enlargement of the "knot" feature at the 2.73KeV energy level. Map 1. Enlargement of the "knot" feature at the 2.73KeV energy level. Map 2. .71Kev Map 1. .71Kev Map 2. 1.11Kev Map 1. 1.11Kev Map 2. 1.74Kev Map 1. 1.74Kev Map 2. 2.73Kev Map 1. 2.73Kev Map 2. 4.29KeV Map 1. 4.29KeV Map 2. New data from NASA's Interstellar Boundary Explorer, or IBEX, spacecraft, reveal that conditions at the edge of our solar system may be much more dynamic than previously thought. Future exploration missions will benefit in design and mission objectives from a better understanding of the changing conditions in this outer region of our solar system.The IBEX has produced a new set of "all-sky" maps of our solar system's interaction with the galaxy, allowing researchers to continue viewing and studying the interaction between our galaxy and sun. The new maps reveal changing conditions in the region that separates the nearest reaches of our galaxy, called the local interstellar medium, from our heliosphere — a protective bubble that shields and protects our solar system.In October 2009, scientists announced that the first map data produced by IBEX revealed an unpredicted bright ribbon of energetic neutral atoms emanating toward the sun from the edge of the solar system. This discovery was unexpected to scientists, because the ribbon of bright emissions did not resemble any previous theoretical models of the region.The IBEX spacecraft creates sky maps by measuring and counting particles referred to as energetic neutral atoms that are created in an area of our solar system known as the interstellar boundary region. This imaging technique is required since this region emits no light that can be collected by conventional telescopes. This interstellar boundary is where charged particles from the sun, called the solar wind, flow outward far beyond the orbits of the planets and collide with material between stars. These collisions cause energetic neutral atoms to travel inward toward the sun from interstellar space at velocities ranging from 100,000 mph to more than 2.4 million mph.This second set of all-sky maps, created using data collected during six months of observations, show the evolution of the interstellar boundary region. The maps help delineate the interstellar boundary region, the area at the edge of our solar system that shields it from most of the dangerous galactic cosmic radiation that would otherwise enter from interstellar space. The new findings were published this week in the Journal of Geophysical Research - Space Physics, a publication of the American Geophysical Union. For More InformationSee [http://www.nasa.gov/home/hqnews/2010/sep/HQ_10-233_IBEX_Findings.html](http://www.nasa.gov/home/hqnews/2010/sep/HQ_10-233_IBEX_Findings.html) Related pages
IBEX First Skymap Release
Oct. 15th, 2009
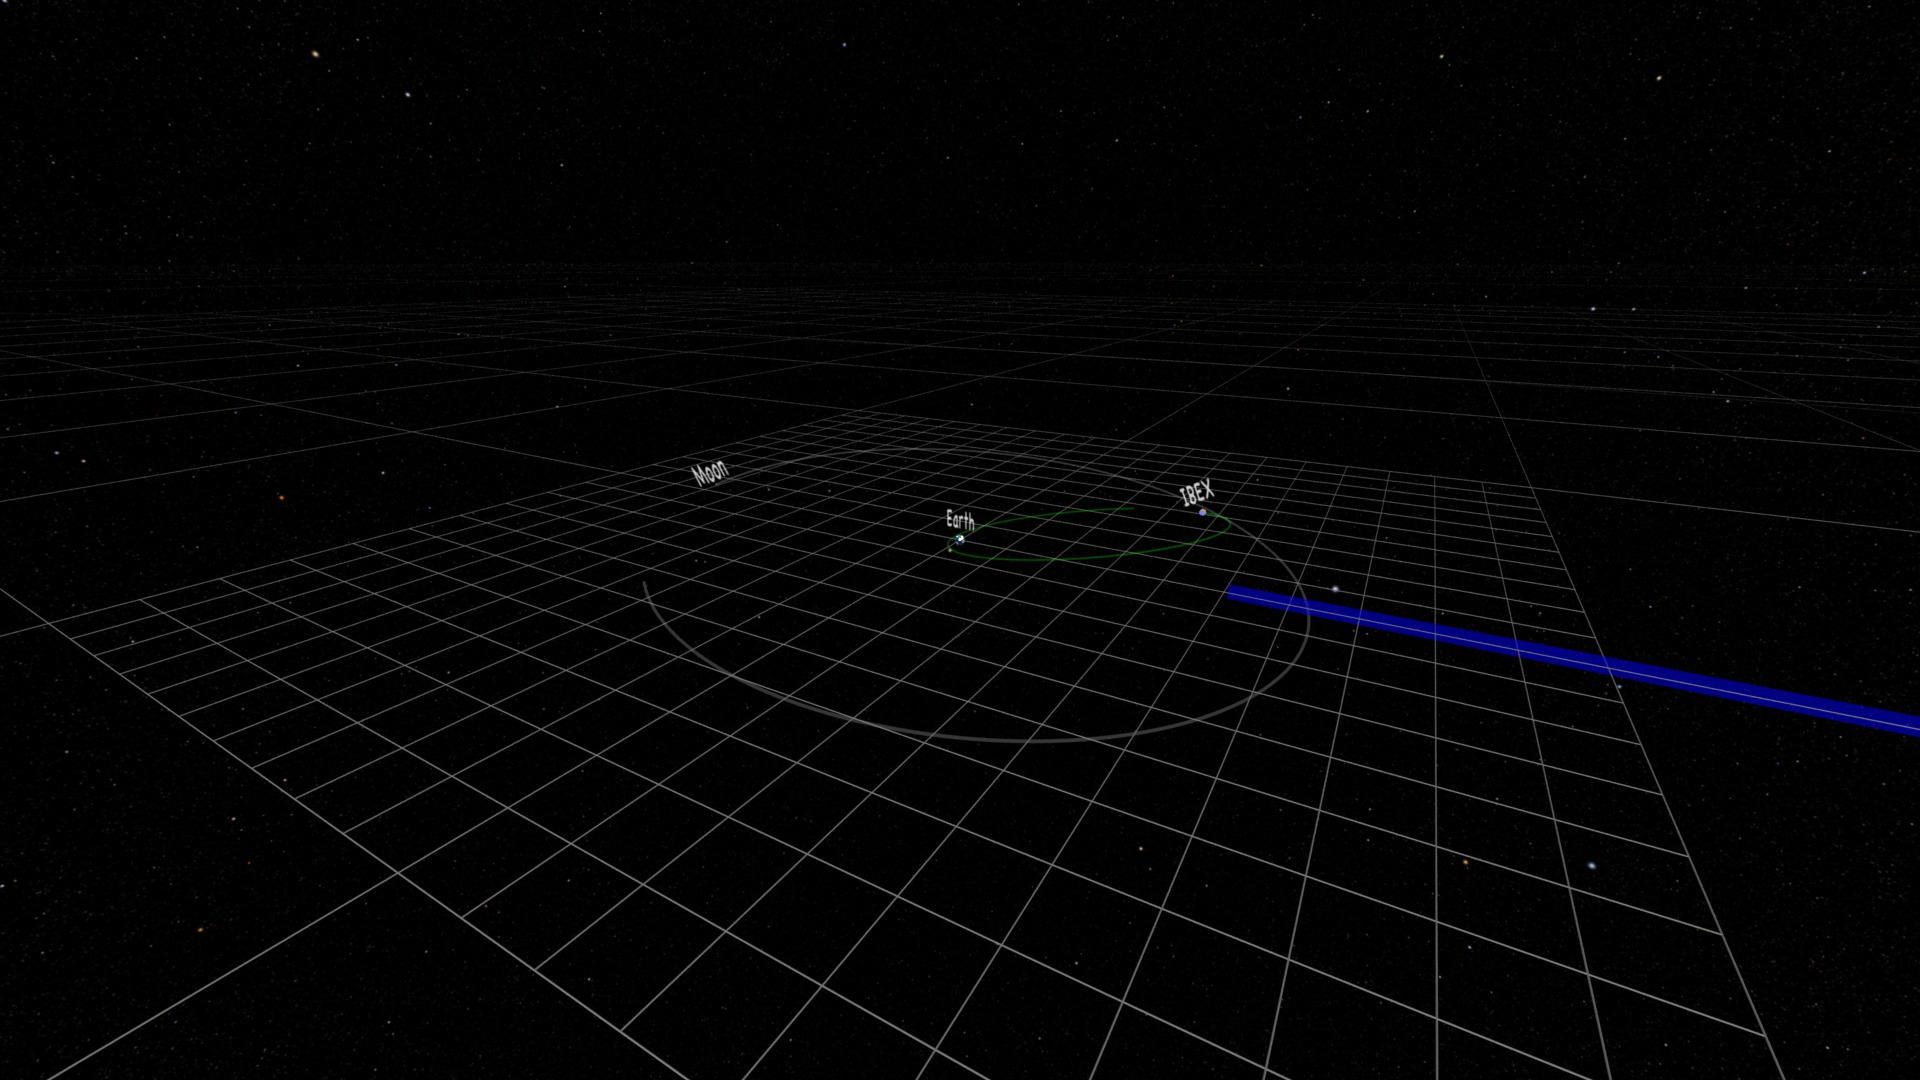
Read moreThis movie pulls out from the region of the IBEX spacecraft to beyond the heliopause, illustrating the region which is the source of the IBEX data. The movie opens with a view looking down on the Earth, the Moon and its orbit, and the IBEX satellite. Our view moves closer to the plane of the ecliptic (the grid) illustrating how the orbit of IBEX extends almost as far as the Moon, but is inclined relative to the lunar orbit. Pulling back from the Earth, we see a more complete view of the IBEX orbit (green) and also fade in a path representing the orbit of the Earth (blue). Pulling back even further from the Earth, we pass the Sun. The violet arrow represents the direction of the Sun's motion with respect to the local interstellar medium. We have now included the IBEX skymap as a semi-transparent layer (revealing the stars beyond). Pulling back farther still, beyond the orbit of Pluto, we view the IBEX skymap in the direction of the Sun's relative motion. We also see the position of the two Voyager spacecraft. We now pass outside the heliopause boundary. The region of emission detected by IBEX is now represented by a thin spherical shell around the Sun. In reality, the emission is probably from a much thicker region but the IBEX skymap cannot determine that scale. We crack open the sphere projecting the IBEX skymap... to view the map within. We now open and distort the sphere projecting the IBEX skymap into a form similar to the Aitoff or Hammer map projection. Colorbar for IBEX skymap. ENA = Energetic Neutral Atoms The Interstellar Boundary Explorer (IBEX) mission science team has used data from NASA's IBEX spacecraft to construct the first-ever all-sky map of the interactions occurring at the edge of the solar system, where the sun's influence diminishes and interacts with the interstellar medium. The interstellar boundary region shields our solar system from most of the dangerous galactic cosmic radiation that would otherwise enter from interstellar space.This visualization illustrates the IBEX satellite in Earth orbit (the orbit reaching almost as far as the orbit of the Moon) and pulls out to beyond the heliopause boundary (the true 3-D nature of the boundary is reduced to a 2-D spherical surface). The sphere with the skymap opens to reproject the data into a near-Aitoff type map projection.The skymap shows the measured flux of energetic neutral atoms (ENAs). For More InformationSee [http://www.nasa.gov/mission_pages/ibex/allsky_map.html](http://www.nasa.gov/mission_pages/ibex/allsky_map.html) Related pages
Launch and Deployment of IBEX
Sept. 15th, 2008
Read moreLaunch and Deployment animation. This animation show the IBEX spacecraft being launched on a pegasus delivery system till it's on station near the Moon. Related pages
Parker Science Result animations
Dec. 4th, 2019
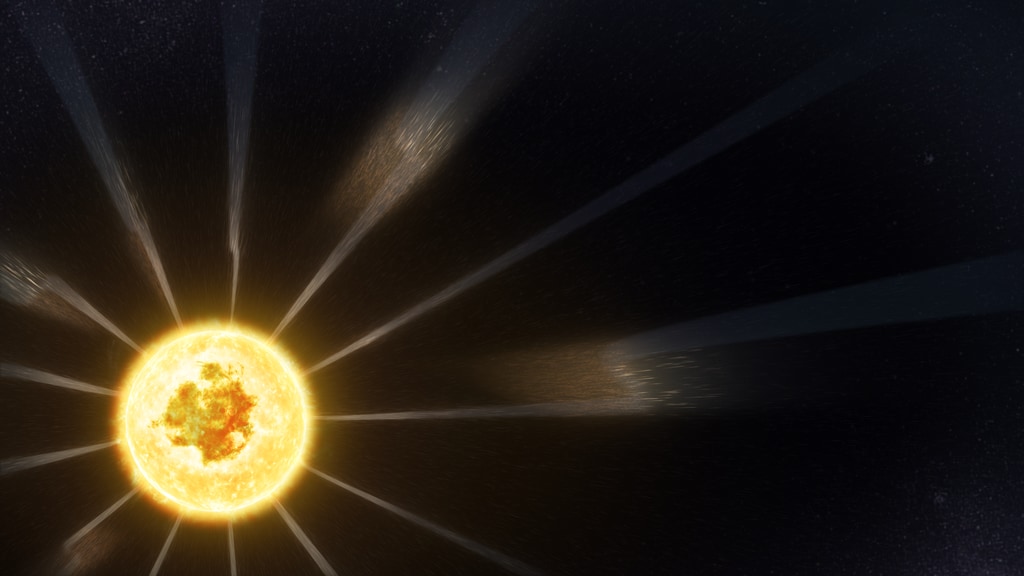
Read moreThe dynamic solar wind Observed near Earth, the solar wind is a relatively uniform flow of plasma, with occasional turbulent tumbles. But by that point it’s traveled over ninety million miles — and the signatures of the Sun's exact mechanisms for heating and accelerating the solar wind are wiped out. Closer to the solar wind's source, Parker Solar Probe saw a much different picture: a complicated, active system. Credit: NASA Goddard/CIL/Adriana Manrique Gutierrez Top-down view of Switchback Magnetic FieldsParker indicated that the solar magnetic field embedded in the solar wind flips in the direction. These reversals — dubbed "switchbacks" — last anywhere from a few seconds to several minutes as they flow over Parker Solar Probe. During a switchback, the magnetic field whips back on itself until it is pointed almost directly back at the Sun.Credit: NASA Goddard/CIL/Adriana Manrique Gutierrez Switchback CloseupParker indicated that the solar magnetic field embedded in the solar wind flips in the direction. These reversals — dubbed "switchbacks" — last anywhere from a few seconds to several minutes as they flow over Parker Solar Probe. During a switchback, the magnetic field whips back on itself until it is pointed almost directly back at the Sun. The spacecraft's approximate location is represented as a dot icon. Credit: NASA Goddard/CIL/Adriana Manrique Gutierrez Artist interreptation of flying by the Earth, Sun and the Heliopause. Credit: NASA Goddard/CIL/Jonathan North Solar Magnetic FieldExactly where the solar wind transitions from a rotational flow to a perfectly radial flow has implications for how the Sun sheds energy. Parker located a transition region in the solar wind's flow. Finding that point may help us better understand the lifecycle of other stars or the formation of protoplanetary disks, the dense disks of gas and dust around young stars that eventually coalesce into planets. The spacecraft's approximate location is represented as a dot icon.Credit: NASA Goddard/CIL/Jonathan North On Dec. 4, 2019, four new papers in the journal Nature describe what scientists working with data from NASA's Parker Solar Probe have learned from this unprecedented exploration of our star — and what they look forward to learning next. These findings reveal new information about the behavior of the material and particles that speed away from the Sun, bringing scientists closer to answering fundamental questions about the physics of our star. These animations represent five of those findings. Related pages
Sun Magnetic Field Flip Live Shots and Media Resources
Dec. 5th, 2013
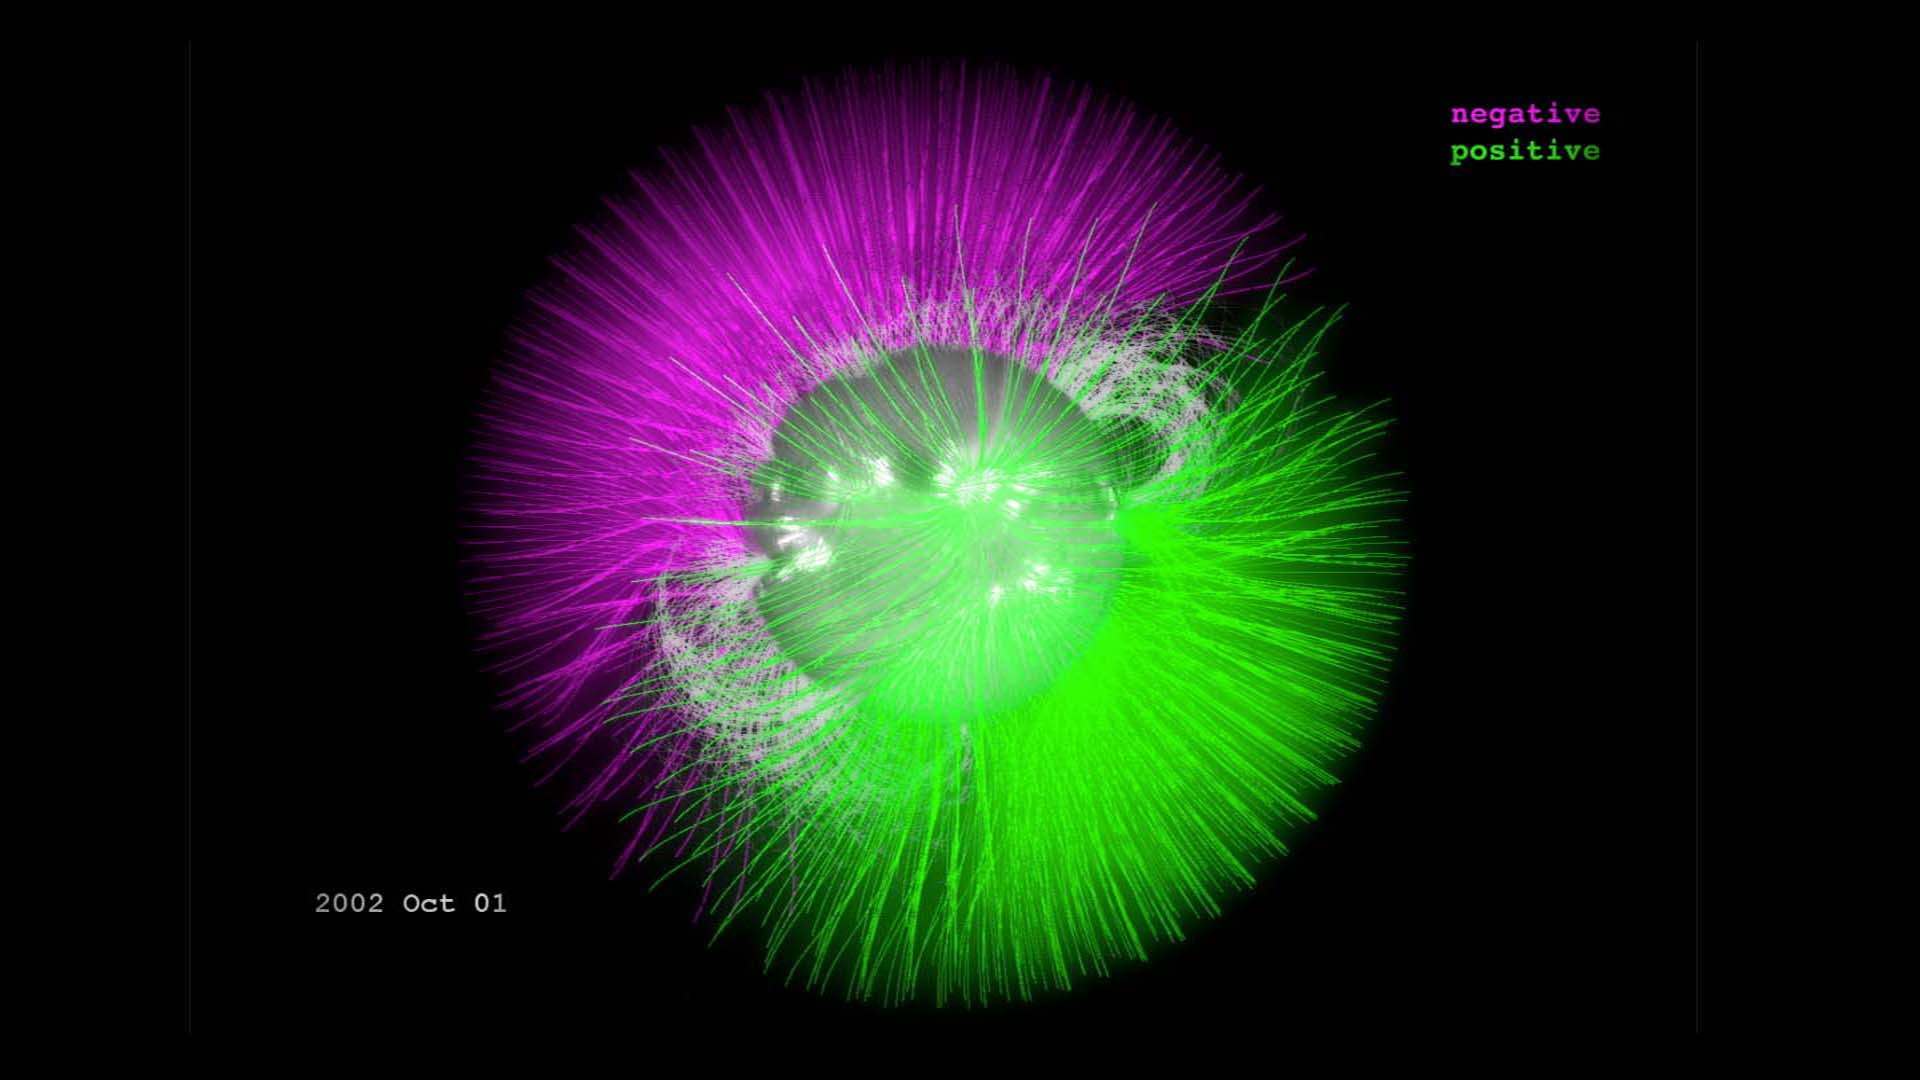
Read moreAlex Young is interviewed about the current solar cycle and what a magnetic flip means for the earth and NASA's study of magnetic fields. Watch this video on the NASA Goddard YouTube channel.This visualization shows the position of the sun's magnetic fields from January 1997 to December 2013. The field lines swarm with activity: The magenta lines show where the sun's overall field is negative and the green lines show where it is positive. Additional gray lines represent areas of local magnetic variation. The entire sun's magnetic polarity, flips approximately every 11 years – though sometimes it takes quite a bit longer – and defines what's known as the solar cycle. The visualization shows how in 1997, the sun shows the positive polarity on the top, and the negative polarity on the bottom. Over the next 16 years, each set of lines is seen to creep toward the opposite pole. By the end of the movie, the flip is almost complete. At the height of each magnetic flip, the sun goes through periods of more solar activity, during which there are more sunspots, and more eruptive events such as solar flares and coronal mass ejections, or CMEs. The point in time with the most sunspots is called solar maximum. Image showing the sun's magnetic fields on Jan. 1, 1997, June 1, 2003, and Dec. 1, 2013. Green indicates postive polarity. Purple is negative. Image shows magnetic fields radiating from the sun's poles. Image shows the magnetic fields of the sun have flipped from the previous image. The blue lines are now at top of the sun and red at the bottom. On Dec. 6, 2013, NASA scientists Alex Young and Holly Gilbert discussed how the sun's magnetic field is in the process of flipping. For More InformationSee [www.nasa.gov/sunearth](www.nasa.gov/sunearth) Related pages
Interstellar Neutral Atoms
Jan. 31st, 2012
Read moreMain animation. Alternate version of animation with target reticle transition. Still from animation. Still from animation. Animation of the interstellar interaction with our Sun-one of billions of stars that orbits around the galaxy. As we zoom in through the galaxy we can see our heliosphere; then if we travel along with the interstellar material, we can see how only a very rare few are directed along precisely the right path to make the 30 year, 15 billion mile journey and enter IBEX's low energy sensor and be detected.For press release media associated with this animation, go: here. Related pages
Heliopause Cycle
Oct. 1st, 2010
Read moreHeliopause cycle animation This animation shows the heliosphere expanding and contracting in response to the solar cycle. As the sun reaches solar maximum, the solar wind increases and expands the heliosphere. During solar minimum, the heliosphere contracts. Related pages
IBEX Observes Changes in Heliopause Emission
Sept. 30th, 2010
Read moreThe movie pans from the direction of the heliospheric 'nose' to the location of the 'knot'. The opening view of the animation looks towards the heliosphere 'nose'. The view pans up to the enhancement in neutral atom flux known as the 'knot'. An artist conception of the 'knot' fades in. As the neutral atom emission fades, the 'knot' has unraveled. Color Bar The camera view moves from the heliosphere 'nose', the apparent direction of the heliopause relative to the interstellar wind, towards the 'knot'. The 'knot' represents a direction of high emission of neutral atoms which has changed significantly in the six months since the first IBEX map.We fade-in an artistic conception of the 'knot', which untangles during the six months as we fade to the second IBEX map. Related pages
Solar Neutral Particles
Oct. 21st, 2008
Read moreSolar particle animation This animation shows a charged solar particle's path leaving the sun, while following the magnetic field lines out to the heliosheath. The solar particle hits a hydrogen atom, stealing its electron and becoming neutral. We then follow it until we see it hit one of IBEX's detectors. Related pages
IBEX Orbit Visualization
Oct. 2nd, 2008
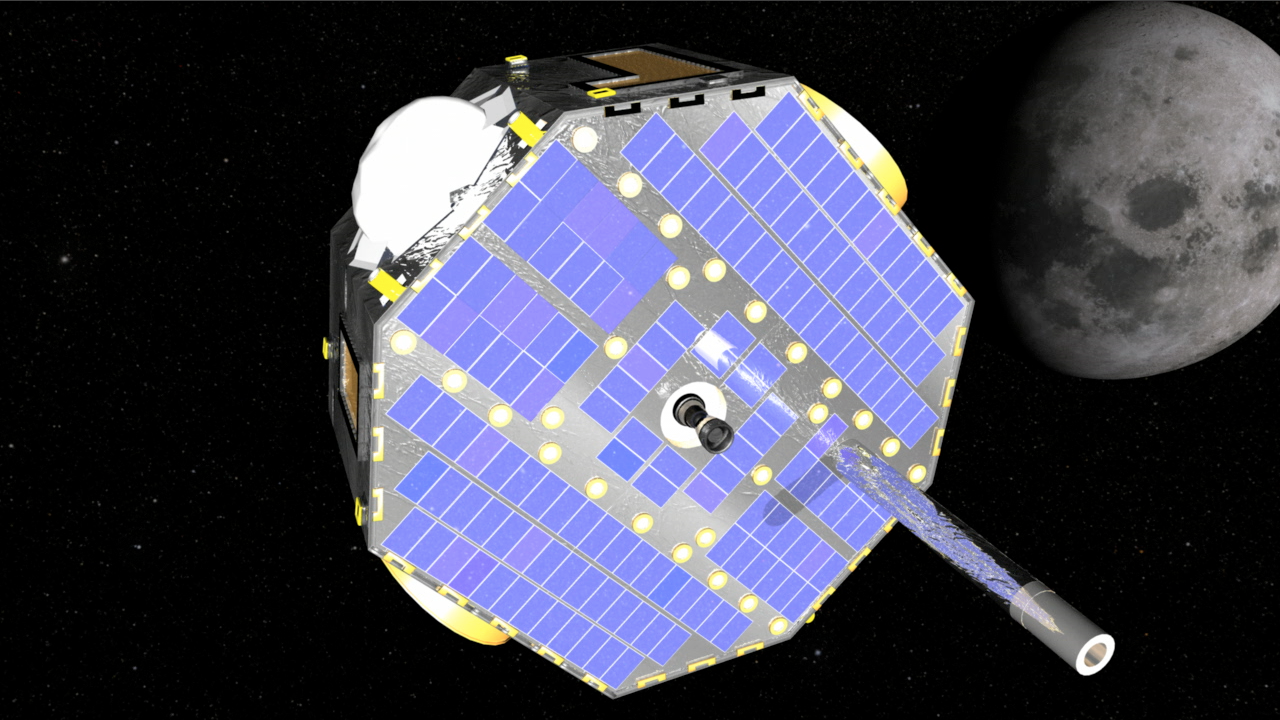
Read moreA movie tour showing the orbit of IBEX (green) around the Earth and its relationship to the Moon's orbit (grey). The movie opens with a view of the Earth with the Sun in the distance. The camera pulls out from the Earth, revealing the IBEX spacecraft (the small gold and grey hexagonal object on the left) and its orbit (green). The Moon is passing through the foreground. The camera pulls out further, to observe the full IBEX orbit. The camera moves above the Moon's orbital plane to look down on the relationship of the orbit of IBEX to the orbit of the Moon. The Interstellar Boundary EXplorer (IBEX) mission will observe the boundary between the heliosphere and the interstellar medium from a location near the Earth. The mission will measure the flux of hydrogen Energetic Neutral Atoms (ENAs) which can be directed towards the Sun by an interaction with the heliosheath. In this visualization, we see the orbit of the spacecraft orbit (green) in relation to the Earth, the orbit of the Moon (gray), and Sun. For more information, visit the IBEX Mission Project Page at Southwest Research Institute which is managing the mission. We also have additional video outlining the mission (link). Related pages
Journey to the Heliopause II
April 1st, 2008
Read moreJourney to the Heliosphere This animation is an update HD version of #010149 that starts at the Sun and pulls back to reveal the Heliosphere. Related pages
Interstellar Boundry Explorer (IBEX)
Dec. 9th, 2007
Read moreIBEX Beauty pass one IBEX Beauty pass two IBEX spacecraft with no alpha channel IBEX spacecraft with alpha channel These animations show IBEX and it's two imagers specialized to detect neutral atoms from the solar system's outer boundaries and galactic medium. Related pages