Intense String of Hurricanes Seen From Space
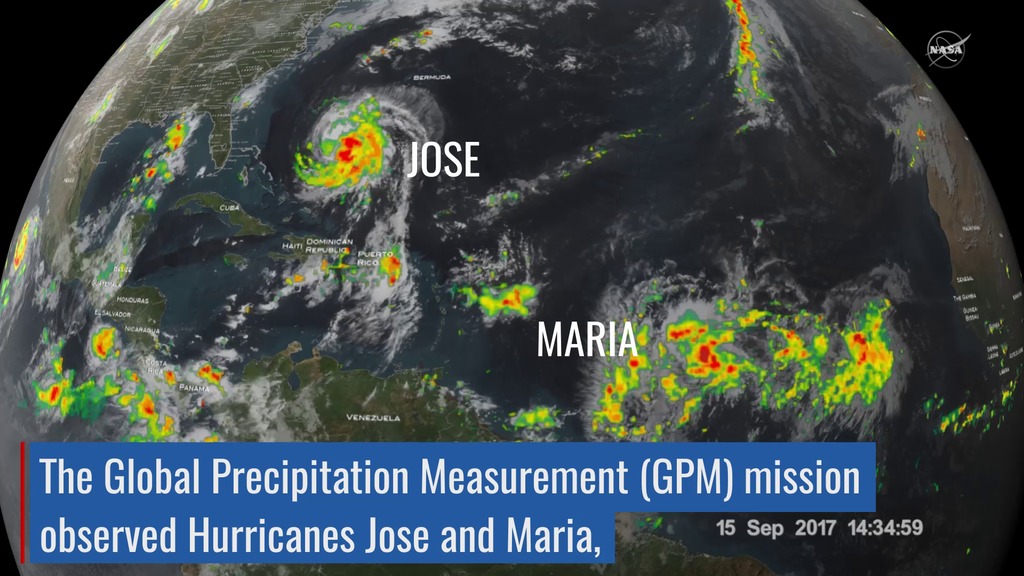
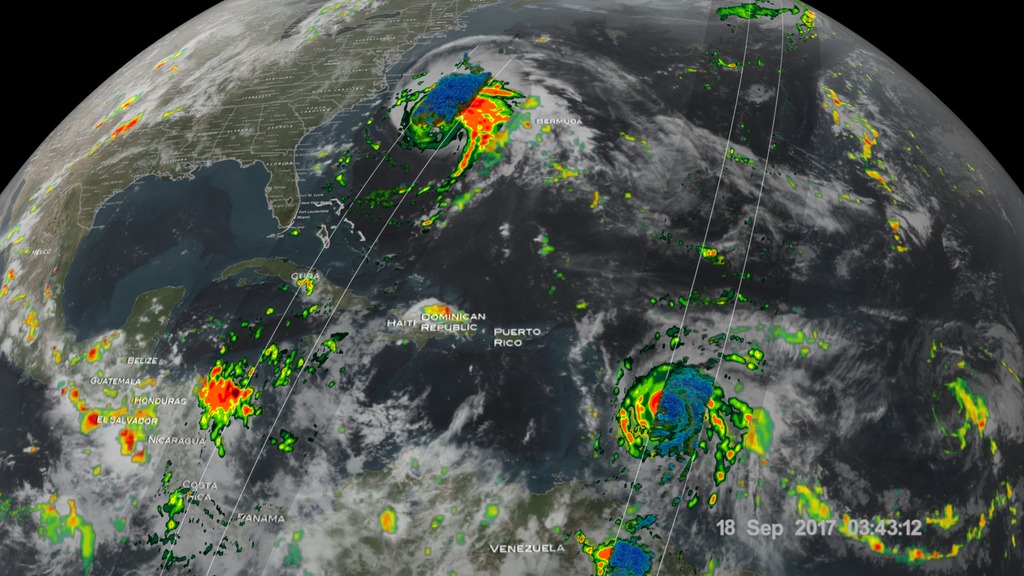
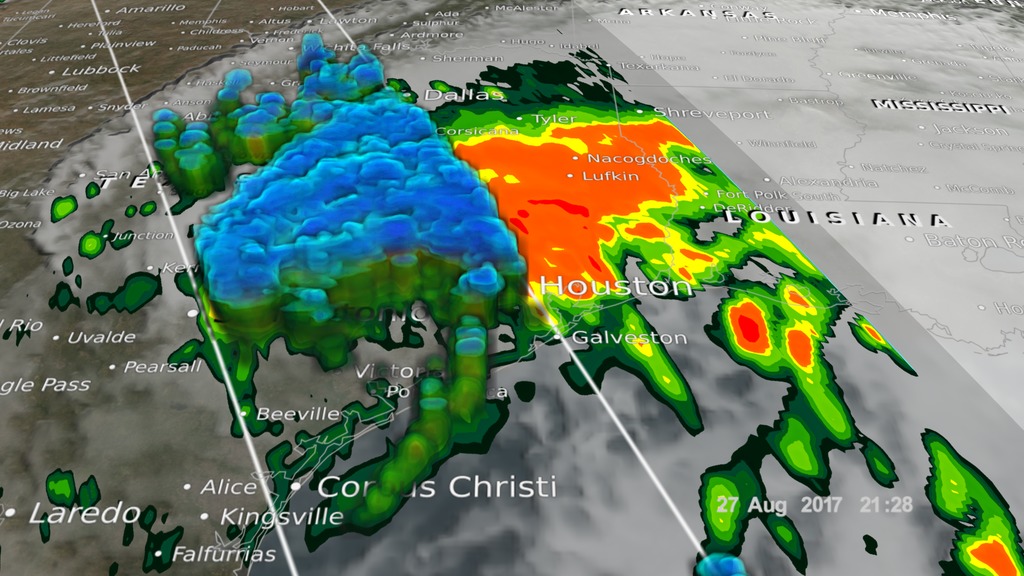
Movies
- APPLE_TV-12738_RapidIntensification_appletv.m4v (1280x720)
- NASA_TV-12738_RapidIntensification.mpeg (1280x720)
- PRORES_B-ROLL-12738_RapidIntensification_prores.mov (1280x720)
- APPLE_TV-12738_RapidIntensification_appletv_subtitles.m4v (1280x720)
- 12738_RapidIntensification_prores.mov (1920x1080)
- LARGE_MP4-12738_RapidIntensification_large.mp4 (1920x1080)
- YOUTUBE_HQ-12738_RapidIntensification_youtube_hq.mov (1920x1080)
- LARGE_MP4-12738_RapidIntensification_large.webm (1920x1080)
- NASA_PODCAST-12738_RapidIntensification_ipod_sm.mp4 (320x240)
Images
- LARGE_MP4-12738_RapidIntensification_large.00084_print.jpg (1024x576)
- LARGE_MP4-12738_RapidIntensification_large.00084_thm.png (80x40)
- LARGE_MP4-12738_RapidIntensification_large.00084_searchweb.png (320x180)
- LARGE_MP4-12738_RapidIntensification_large.00084_web.png (320x180)
Right click movies to download them if they automatically play in your browser.
Watch this video on the NASA Goddard YouTube channel.
Complete transcript available.
Music credits: 'Micro Currents' by Jean-Patrick Voindrot [SACEM], 'Sink Deep' by Andrew Michael Britton [PRS], David Stephen Goldsmith [PRS], Mikey Rowe [PRS] from Killer Tracks.
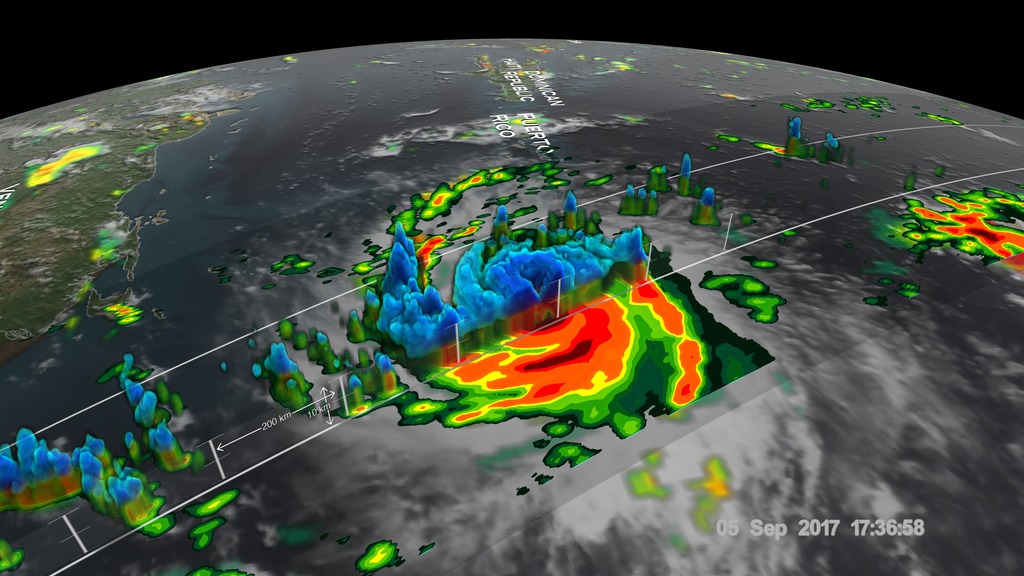
When hurricanes intensify a large amount in a short period, scientists call this process rapid intensification. This is the hardest aspect of a storm to forecast and it can be most critical to people’s lives.
While any hurricane can threaten lives and cause damage with storm surges, floods, and extreme winds, a rapidly intensifying hurricane can greatly increase these risks while giving populations limited time to prepare and evacuate.

Images
- RI.gif (1280x720)
Right click movies to download them if they automatically play in your browser.
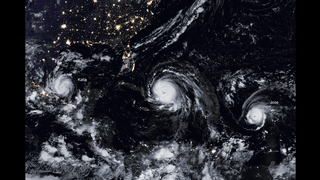
Rapid intensification is the hardest aspect of a storm to forecast and it can be most critical to people's lives. This GIF is optimized for posting on Twitter.

Images
- 2017_RI.gif (1280x720)
Right click movies to download them if they automatically play in your browser.
Rapidly intensifying storms typically occur up to twice in a hurricane season. But in 2017, we have seen four storms rapidly intensify and scientists attribute this to warmer ocean waters and favorable winds. This GIF is optimized for posting on Twitter.
Credits
Please give credit for this item to:
NASA's Goddard Space Flight Center
Scientists
- Amber Emory (NASA/GSFC)
- Dalia B Kirschbaum (NASA/GSFC)
- Scott Braun (NASA/GSFC)
- Stephen J. Munchak (University of Maryland)
Producer
- Joy Ng (KBRwyle)
Support
- Aries Keck (ADNET)
- Patrick Lynch (NASA/GSFC)
- Rob Gutro (NASA/GSFC)
- Ryan Fitzgibbons (KBRwyle)
Missions
This visualization is related to the following missions:Series
This visualization can be found in the following series:Related pages
NASA Catches Hurricanes Jose and Maria
Sept. 20, 2017, 6 a.m.
Read moreMusic: (as it releases a huge quantity of latent heat by condensation). These tall thunderstorms in the eye wall are often a sign that a tropical cyclone is becoming more powerful. Maria rapidly intensified following this view to a Category 5 storm on September 19th.
A Menacing Line of Hurricanes
Sept. 18, 2017, noon
Read moreVIIRS imagery of Katia, Irma, and Jose || Meteorologists struggled to find the right words to describe the situation as a line of three hurricanes—two of them major and all of them threatening land—brewed in the Atlantic basin in September 2017. Forecasters were most concerned about Irma, which was on track to make landfall in densely populated South Florida on September 10 as a large category 4 storm. Meanwhile, category 2 Hurricane Katia was headed for Mexico, where it was expected to make landfall on September 9. And just days after Irma devastated the Leeward Islands, the chain of small Caribbean islands braced for another blow—this time from category 4 Hurricane Jose.The Visible Infrared Imaging Radiometer Suite (VIIRS) on the Suomi NPP satellite captured the data for a mosaic of Katia, Irma, and Jose as they appeared in the early hours of September 8, 2017. The images were acquired by the VIIRS “day-night band,” which detects light signals in a range of wavelengths from green to near-infrared, and uses filtering techniques to observe signals such as city lights, auroras, wildfires, and reflected moonlight. In this case, the clouds were lit by the nearly full Moon. The image is a composite, showing cloud imagery combined with data on city lights.
NASA Captures Hurricane Harvey's Rainfall
Aug. 30, 2017, 8 a.m.
Read moreMusic: s circulation still reaching out over the Gulf, the storm is able to draw in a continuous supply of warm moist air to sustain the large amount of rain it is producing. || This is the visualization only, which runs up through August 30, 2017. This has no music or text overlays, only the color bars.
Flying Over Hurricanes For New NASA Mission
July 25, 2017, 5:30 a.m.
Read moreMusic credit: by Laurent Levesque [SACEM] from Killer TracksComplete transcript available.Watch this video on the NASA Goddard YouTube channel. || NASA scientists are investigating key questions about hurricanes in a new mission from the skies. This August, the East Pacific Origins and Characteristics of Hurricanes, or EPOCH, mission will fly over East Pacific storms to better understand how they form and intensify. EPOCH will conduct up to six 24-hour science flights using the Global Hawk unmanned aircraft. Three of the flights are being supported through a partnership with the NOAA UAS Program. Data will be collected using three instruments (EXRAD, HAMSR, and AVAPS) aboard the aircraft that will map out the 3-D patterns of temperature, pressure, humidity, precipitation, and wind speed - key factors that influence hurricane behavior. NASA scientists use a combination of ground, modeled, and satellite data to re-create multi-dimensional pictures of hurricanes and other major storms in order to study complex atmospheric interactions.
Building a Hurricane Season in the Atlantic Ocean
July 24, 2017, 9 p.m.
Read moreMusic: Eternal Sunset by Alexandre Prodhomme [SACEM]Complete transcript available. || For decades, NASA researchers have helped refine our understanding of hurricanes and tropical storms. To better understand the Atlantic hurricane season, they use the Goddard Earth Observing System (GEOS-5) model run by supercomputers at NASA s Global Modeling and Assimilation Office (GMAO) simulated the conditions in the ocean and atmosphere that give rise to tropical storms and hurricanes. From these simulations, he can better isolate and understand which factors play a role in driving a busy or a slow Atlantic hurricane season. The full study is available here. || Hurricane Animation
A New Multi-dimensional View of a Hurricane
July 24, 2017, 8 p.m.
Read moreMusic: Donn Wilkerson, Killer Tracks.Complete transcript available. || NASA researchers now can use a combination of satellite observations to re-create multi-dimensional pictures of hurricanes and other major storms in order to study complex atmospheric interactions. In this video, they applied those techniques to Hurricane Matthew. When it occurred in the fall of 2016, Matthew was the first Category 5 Atlantic hurricane in almost ten years. Its torrential rains and winds caused significant damage and loss of life as it coursed through the Caribbean and up along the southern U.S. coast.
NASA Has Eyes On The Atlantic Hurricane Season
June 3, 2019, 8 a.m.
Read moreComplete transcript available.Music credits: “Northern Breeze” by Denis Levaillant [SACEM], “Stunning Horizon” by Maxime Lebidois [SACEM], Ronan Maillard [SACEM], “Magnetic Force” by JC Lemay [SACEM] from Killer TracksWatch this video on the NASA Goddard YouTube channel.This video can be freely shared and downloaded. While the video in its entirety can be shared without permission, some individual imagery provided by pond5.com is obtained through permission and may not be excised or remixed in other products. Specific details on stock footage may be found here. For more information on NASA’s media guidelines, visit https://www.nasa.gov/multimedia/guidelines/index.html.Notes on footage:• 0:03 - 0:17 provided by Pond5• 1:38 - 1.43 provided by Pond5• 1:49 - 1:52 provided by Pond5• 2:21 - 1:27 provided by Pond5 || NASA has a unique and important view of hurricanes around the planet. Satellites and aircraft watch as storms form, travel across the ocean and sometimes, make landfall. After the hurricanes have passed, the satellites and aircraft see the aftermath of hurricanes, from downed forests to mass power loss. || GIFThe Global Modeling and Assimilation Office (GMAO) at NASA’s Goddard Space Flight Center created this visualization using the Goddard Earth Observing System (GEOS) computer model. When combined with data from NASA’s satellites, the model becomes a tool for scientists to fully understand aerosols’ impact and how they fit into the global Earth system. || GIFFrom space, NASA satellites can monitor hurricanes as they form, develop and dissapate. || GIFNASA s forests six months before the storm with Goddard’s Lidar, Hyperspectral, and Thermal (G-LiHT) Airborne Imager, a system designed to study the structure and species composition of Puerto Rican forests. Shooting 600,000 laser pulses per second, G-LiHT produces a 3D view of the forest structure in high resolution. In April 2018, post-Maria, they went back and surveyed the same tracks as in 2017.
Hurricane Jose lingers in the Atlantic as Hurricane Maria approaches Puerto Rico
Sept. 18, 2017, 8 p.m.
Read moreGPM passed over both Hurricane Maria and Hurricane Jose on September 18th, 2017. As the camera moves in on the Maria, DPR (as it releases a huge quantity of latent heat by condensation). These tall thunderstorms in the eye wall are often a sign that a tropical cyclone is becoming more powerful. Maria rapidly intensified following this view to a Category 5 storm on September 19th. || Color bar for liquid precipitation rates (ie, rain rates). Shades of green represent low amounts of liquid precipitation, whereas shades of red represent high amounts of precipitation. || Color bar for frozen precipitation rates (ie, snow rates). Shades of cyan represent low amounts of frozen precipitation, whereas shades of purple represent high amounts of precipitation. || Print resolution still image of Hurricane Maria on September 18th, 2017. || Print resolution still image of Hurricane Maria on September 18th, 2017. || Print resolution still image of Hurricane Maria on September 18th, 2017. || Print resolution still image of Hurricane Maria and Hurricane Jose on September 18th, 2017.
GPM Examines Hurricane Irma
Sept. 10, 2017, 8 a.m.
Read moreGPM scans Hurricane Irma on September 5th and again on September 7th as the storm approaches Puerto Rico, the Dominican Republic, and Haiti as a category 5 hurricane. This video is also available on our YouTube channel. || The GPM core observatory satellite had an exceptional view of hurricane Irma s in the Gulf about 10 days earlier. || GPM scans Hurricane Irma on September 5th and again on September 7th as the storm approaches Puerto Rico, the Dominican Republic, and Haiti as a category 5 hurricane. This version has no dates. || Dates-only version corresponding the the visualization above. || Color bar for liquid precipitation rates (ie, rain rates). Shades of green represent low amounts of liquid precipitation, whereas shades of red represent high amounts of precipitation. || Color bar for frozen precipitation rates (ie, snow rates). Shades of cyan represent low amounts of frozen precipitation, whereas shades of purple represent high amounts of precipitation. || Print resolution still image of Hurricane Irma approaching Puerto Rico on September 5th, 2017 || Print resolution still image of Hurricane Irma approaching Puerto Rico on September 5th, 2017. A cutting plane slices through 3D precipitation data to expose the eye of storm. || Print resolution still image of Hurricane Irma off the coast of Haiti on September 7th, 2017. || Print resolution still image of Hurricane Irma off the coast of Haiti on September 7th, 2017.
Harvey Floods Texas and Threatens Louisiana (Final Tropical Storm Update)
Aug. 31, 2017, 1 p.m.
Read moreGPM caught Tropical Storm Harvey twice on August 30th, 2017. This time the storm made landfall in Louisiana and moved up east of the Texas/Louisiana border pounding already drenched eastern Texas and western Louisiana with more rain. || The Global Precipitation Mission (GPM) Core Observatory captured these images of Hurricane Harvey August 27th through the 30th, 2017.At 11:45 UTC and 21:25 UTC on the 27th of August nearly two days after the storm made landfall Harvey was meandering slowly southeast at just 2 mph (~4 kph) near Victoria, Texas west of Houston. The images at this stage show rain rates derived from GPM s precipitation structure expands all the way out over eastern Louisiana. || Print resolution image of Harvey on August 30th, 2017 at 10:40 UTC as it stalled over the Texas and Louisiana border continuing to dump more rain. || Print resolution image of Harvey as a Tropical Storm still lingering over the Texas and Louisiana border on August 30th, 2017 at 20:24 UTC.
GPM Core Spacecraft Beauty Passes
Oct. 31, 2013, 1 p.m.
Read moreVarious beauty passes of the GPM Core spacecraft. || A variety of animated beauty passes of the Global Precipitation Measurement (GPM) Core spacecraft. || The GPM Core satellite cruises over a hurricane.
Global Sea Surface Currents and Temperature
March 16, 2012, 6 a.m.
Read moreGlobal sea surface currents colored by temperature. These are the assembled (contiguous) versions of the animation. There are several resolutions to choose from, some are cropped for various purposes. The 6840x3420 version is the complete, full resolution visualization at the appropriate 2x1 aspect ratio and has not been cropped or resized. The time range for these visualizations is from 2007-03-25T12:00Z to 2008-03-03T12:00Z. || This visualization shows sea surface current flows. The flows are colored by corresponding sea surface temperature data. This visualization is rendered for display on very high resolution devices like hyperwalls or for print media.This visualization was produced using model output from the joint MIT/JPL project entitled Estimating the Circulation and Climate of the Ocean, Phase II (ECCO2). ECCO2 uses the MIT general circulation model (MITgcm) to synthesize satellite and in-situ data of the global ocean and sea-ice at resolutions that begin to resolve ocean eddies and other narrow current systems, which transport heat and carbon in the oceans. The ECCO2 model simulates ocean flows at all depths, but only surface flows are used in this visualization. || A cropped region in the Pacific illustrating the distribution of the actual flow vector data points relative to the flow curves. The white dots represent locations where the ECCO2 model defines the ocean current directions. Locations in between those locations are interpolated. || A cropped region in the Atlantic illustrating the distribution of the actual flow vector data points relative to the flow curves. The white dots represent locations where the ECCO2 model defines the ocean current directions. Locations in between those locations are interpolated. Notice the irregular distribution of grid points (e.g., bright spot near the center). This is due to the advanced cube-sphere distribution of the data points. The bright spot is one of the cube-sphere corners. || Full resolution ECCO2 flow field illustrating the distribution of the actual flow vector data points relative to the flow curves. The white dots represent locations where the ECCO2 model defines the ocean current directions. Locations in between those locations are interpolated. || Sea surface currents and temperatures cropped, scaled, and diced for a 5x3 hyperwall.Date and time information for each frame can be found here. Individual cut-up frames and movie files are available for download. || Sea Surface currents of the northern Atlantic Ocean. This version was produced for a 5x3 hyperwall. || Hyperwall material - Does not display. || Sea surface temperature color bar (blue is 0 degrees C, green is 10-20 degrees C, yellow is about 25 degrees C, red is 32 degrees C) || This visualization shows the sea surface currents and temperatures in the eastern Pacific Ocean.