A New View of August's Total Solar Eclipse
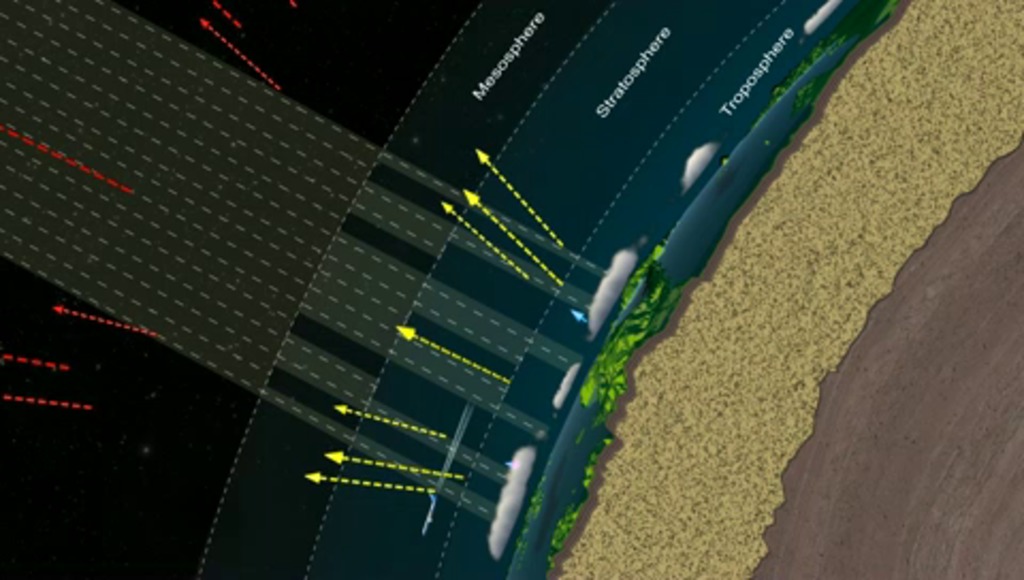
- Written by:
- Kasha Patel
- Produced by:
- Kathryn Mersmann
- View full credits
Movies
- WEBM-EPICEclipse_Rescript.webm (960x540) [36.2 MB]
- APPLE_TV-EPICEclipse_Rescript_appletv.m4v (1280x720) [46.1 MB]
- APPLE_TV-EPICEclipse_Rescript_appletv_subtitles.m4v (1280x720) [46.2 MB]
- YOUTUBE_1080-EPICEclipse_Rescript_youtube_1080.mp4 (1920x1080) [147.4 MB]
- LARGE_MP4-EPICEclipse_Rescript_large.mp4 (1920x1080) [91.2 MB]
- NASA_PODCAST-EPICEclipse_Rescript_ipod_sm.mp4 (320x240) [15.0 MB]
Captions
- EPICEclipse.en_US.srt [1.7 KB]
- EPICEclipse.en_US.vtt [1.7 KB]
Images
- LARGE_MP4-EPICEclipse_Rescript_large.00696_print.jpg (1024x576) [161.9 KB]
- LARGE_MP4-EPICEclipse_Rescript_large.00696_thm.png (80x40) [6.9 KB]
- LARGE_MP4-EPICEclipse_Rescript_large.00696_searchweb.png (320x180) [96.0 KB]
Music: Dawn Drone by Juan Jose Alba Gomez [SGAE]
Complete transcript available.

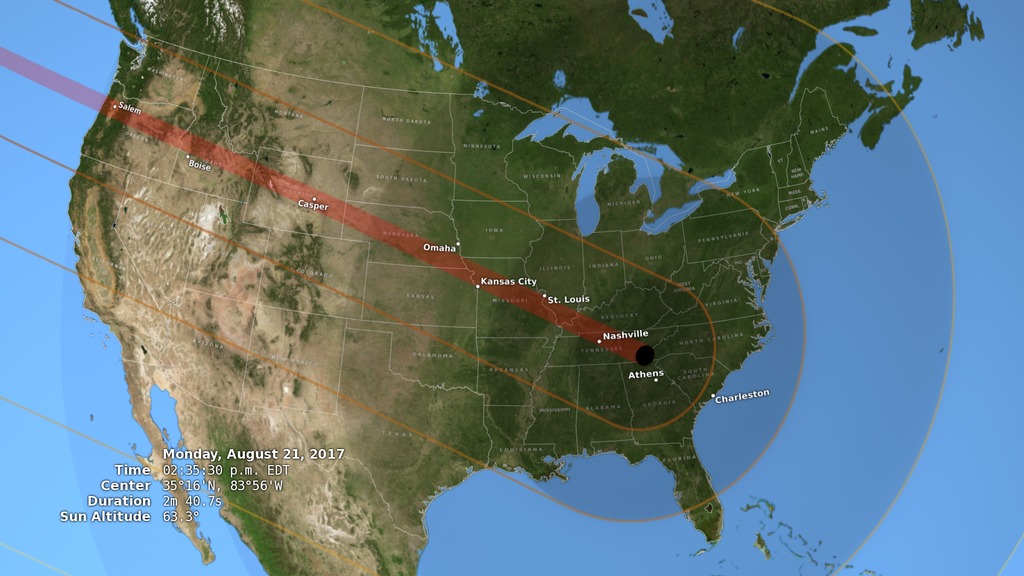
During the eclipse, scientists will take ground measurements in Casper, Wyo. and Columbia, Mo.

DSCOVR's Earth Polychromatic Imaging Camera (EPIC) 
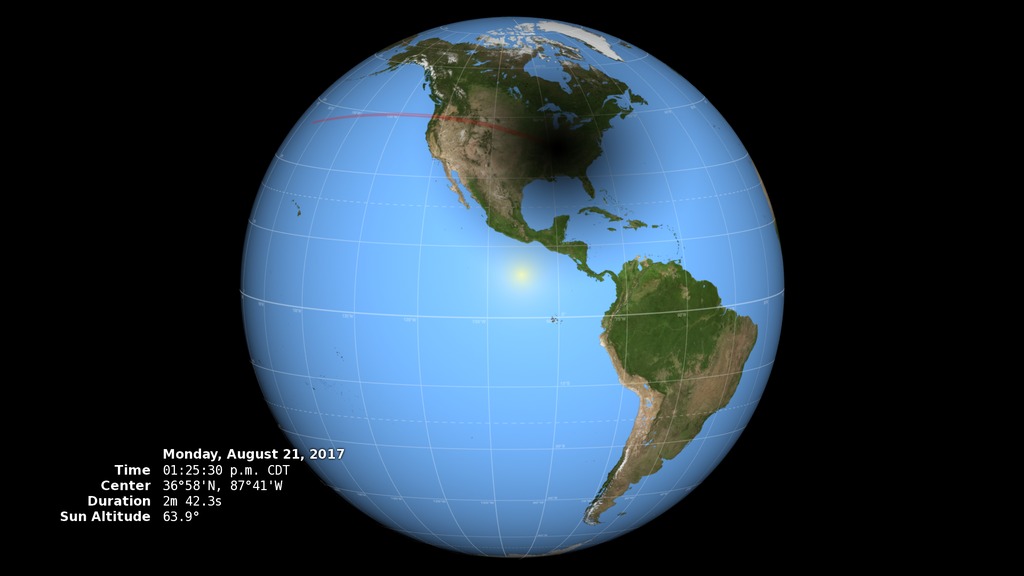
will capture images similar to this one from the Lagrange 1 point, about a million miles away from Earth.
Credits
Please give credit for this item to:
NASA's Goddard Space Flight Center
Writer
- Kasha Patel (Wyle Information Systems) [Lead]
Editor
- Rani Gran (NASA/GSFC)
Scientist
- Jay Herman (NASA/GSFC)
Producer
- Kathryn Mersmann (KBRwyle) [Lead]
Narrator
- Kasha Patel (Wyle Information Systems)
Series
This visualization can be found in the following series:Related pages
An EPIC View of the 2017 Total Solar Eclipse
Aug. 22nd, 2017
Read moreNASA's EPIC instrument captured this view of the 2017 total solar eclipse.Music: Early Morning by Damien Deshayes [SACEM]Complete transcript available. Eclipse Video without TextMusic: Even Closer by Francois Vey [SACEM] Looping Gif of Eclipse NASA's Earth Polychromatic Imaging Camera (EPIC) tracked the path of the total solar eclipse across North America on Aug. 21, 2017. On board NOAA's Deep Space Climate Observatory (DSCOVR), EPIC collected these natural color images. Scientists set the instrument to gather images more frequently than usual to study this eclipse.Learn more about how EPIC contributed to research conducted during the 2017 total solar eclipse. Related pages
Are You Ready for the Eclipse? (Live Interviews on Aug. 16, 2017)
Aug. 5th, 2017
Read moreCanned interviews and b-roll will be available here starting Tuesday, August 15, at 6:00 p.m. ET. B-roll that goes along with 8.16.17 eclipse live shots. Canned interview with NASA Scientist, Dr. Nicholeen Viall. Canned interview with Dr Michelle Thaller/ NASA Scientist looking on camera. Each question is separated by a slate and there are two versions of each answer - one with graphics rolling during the SOT and one without graphics. TRT 9:52 Are you ready for the historic solar eclipse that’s just days away?Do you have what you need to see it safely?You can see the eclipse no matter where you are in North America on Aug. 21!August 21 will be a day for the history books. No matter where you are in North America, you’ll get to experience the first coast-to-coast solar eclipse in nearly a century! The dark shadow of the moon will sweep from Oregon to South Carolina, putting 14 states in the path of totality and providing a spectacular view of a partial eclipse across all 50 states.Eclipses are an incredible experience, but it’s important to view them safely. Join NASA scientists on Wednesday, August 16, from 6:00 a.m. – 12:30 p.m. ET and again from 3:00 p.m. – 8:00 p.m. ET to show your viewers what they need to safely see the eclipse whether they’re inside the path of totality or not. You should never look directly at the sun! The only safe way to look directly at the sun or partially eclipsed sun is through special-purpose solar filters, such as “eclipse glasses” or hand-held solar viewers. An eclipse is a striking phenomenon you won't want to miss, but you must carefully follow safety procedures.Solar eclipses happen somewhere in the world about every 18 months, but much of the time it happens over the ocean. To have an eclipse travel across so much land where millions of people live is incredibly rare, and makes for a unique opportunity for so many to witness one of nature’s most impressive shows. It’s also a great opportunity for scientists to see the sun’s faint outer atmosphere and evaluate how Earth responds to the sudden darkening.Take this opportunity to step outside and safely watch one of nature’s best shows!*** To book a window ***Contact Michelle Handleman michelle.z.handleman@nasa.gov / 301-286-0918HD Satellite Digital Coordinates for G17-K20/Up: Galaxy 17, Ku-band Xp 20, Slot Upper | 91.0 ° W Longitude | DL 12109.0 MHz | Vertical Polarity | QPSK/DVB-S | FEC 3/4 | SR 13.235 Mbps | DR 18.2954 MHz | HD 720p | Format MPEG2 | Chroma Level 4:2:0 | Audio EmbeddedSuggested Questions:1. The anticipated solar eclipse is just days away! What will we experience next week?2. We’ve been told never to look directly at the sun (even with sunglasses!). How can we enjoy this eclipse safely?3. For those in the path of totality – when is it safe to finally take off our solar glasses?4. We’re not in the path of totality – what interesting things should we lookout for?5. Why are you excited for this eclipse?6. Where can we learn more?Extra Questions for Longer Interviews:7. How did a picture of an eclipse in 1919 prove Einstein’s theory of relativity?8. Eclipses are actually a special type of transit. How are transits helping scientists search for life on other planets?9. Why does an eclipse only last for a few minutes?10. What happens to Earth during the eclipse?11. If you were looking back at Earth during the eclipse what would you see?12. How has our precise mapping of the moon helped us predict the path of eclipses?13. How long and where was the longest ever recorded eclipse?Location: NASA’s Goddard Space Flight Center/Greenbelt, MarylandInterviews With:Dr. Michelle Thaller / NASA ScientistDr. Alex Young / NASA ScientistDr. Jim Garvin / NASA ScientistDr. Nicholeen Viall / NASA ScientistDr. Eric Christian / NASA ScientistDr. Yari Collado-Vega / NASA Scientist [Spanish speaker]Dr. Geronimo Villanueva / NASA Scientist [Spanish speaker]https://eclipse2017.nasa.gov/@NASASunHow to photograph an eclipse.Planning to take photos of the eclipse? Check out our tips for capturing the best images:#Eclipse2017 Related pages
One Month & Counting: Solar Eclipse Liveshots (July 21, 2017)
July 10th, 2017
Read moreCanned interviews will be available by 6:00 p.m. ET on July 20, 2017. B-roll package for liveshot. Canned soundbites with Dr. Alex Young. TRT 4:59. Includes full transcript answering the following questions:1. What’s going to happen one month from today? [answer includes safety information]2. Why is this eclipse special to NASA?3. How can our viewers participate?4. We live on a solar powered planet. How does energy from the sun impact Earth?5. How can we safely view the eclipse?6. Where can we learn more? Soundbites with NASA Scientist Dr. Michelle Thaller looking off camera. TRT 4:06. Includes full text of the soundbites. SOTs are separated by a slate. She answers the following questions:1. What's going to happen one month from today?2. What's it like to see an eclipse?3. How can we view the eclipse safely?4. How can our viewers participate?5. What is NASA's new mission that will collect information on the sun-Earth relationship? One Month and Counting: Solar Eclipse Visible From Everywhere in North AmericaBecome a Citizen Scientist During the Eclipse, Using the GLOBE Phone AppHelp Scientists Study What Happens When Earth Goes Dark During the Solar EclipseOne of the most anticipated solar eclipses in history is just a month away. The August 21 solar eclipse provides a unique opportunity to study our planet and what happens when Earth goes dark during an eclipse. It’s also an opportunity for what may be the largest citizen science project of all time.On that Monday, the moon’s shadow will darken the sky, causing temperatures to drop and stars to become visible in the normally day lit sky. This brief hiccup in the usual day-night cycle changes the amount of energy an area gets from the sun.NASA scientists hope to learn just how much Earth’s environment changes during this historic eclipse and they need help from your viewers! Using the GLOBE Observer phone application, curious eclipse onlookers can become citizen scientists. This resulting data will help us better understand the important relationship between the sun and Earth.Join NASA scientists on Friday, July 21 from 6:00 a.m. – 12:00 p.m. ET to find out where your viewers can see the eclipse and how they can participate, whether they’re viewing from the path of totality or not!Everyone in North America (weather dependent) will experience an eclipse, one of nature’s rarest shows – even those outside the path of totality. For the first time since 1918, the dark shadow of the moon will sweep coast-to-coast across the United States, putting 14 states in the path of totality and providing a spectacular view of a partial eclipse across all 50 states.HD Satellite Coordinates for G17-K18/LO: Galaxy 17 Ku-band Xp 18 Slot Lower| 91.0 ° W Longitude | DL 12051.0 MHz | Vertical Polarity | QPSK/DVB-S | FEC 3/4 | SR 13.235 Mbps | DR 18.2954 MHz | HD 720p | Format MPEG2 | Chroma Level 4:2:0 | Audio Embedded*** To book a window contact*** Clare Skelly / clare.a.skelly@nasa.gov / (301) 286-4994Suggested Questions:1. What’s going to happen one month from today? [answer includes safety information]2. Why is this eclipse special to NASA?3. How can our viewers participate?4. We live on a solar powered planet. How does energy from the sun impact Earth?5. Where can we learn more?Extra Questions for Longer Interviews:6. Tell us about the new mission NASA is preparing to launch that will continue to collect information on the sun-Earth relationship.7. Can solar eclipses be seen from other planets and what do they look like?8. An eclipse is a type of transit. How can astronomers use transits to detect planets orbiting other stars?Location: NASA’s Goddard Space Flight Center / Greenbelt, MarylandScientists:Dr. Michelle Thaller / NASA ScientistDr. Jim Garvin / NASA ScientistDr. Alex Young / NASA ScientistDr. Ivona Cetinic / NASA ScientistVideo: NASA will roll all insert videos during live interviews. If needed, stations can roll a clean feed of all video at 5:45 a.m. ET on July 21, 2017, at the above listed satellite.Download the GLOBE Observer Application for iOS or Android.For eclipse information, maps and safety: https://eclipse2017.nasa.gov/To learn more about the GLOBE program: https://observer.globe.gov/For more information about how NASA studies Earth: https://www.nasa.gov/earth For More InformationSee [https://eclipse2017.nasa.gov/](https://eclipse2017.nasa.gov/) Related pages
Earth's Energy Budget
July 20th, 2017
Read moreNASA's Total and Spectral solar Irradiance Sensor, or TSIS-1, is a mission to measure the sun's energy input to Earth. Various satellites have captured a continuous record of this solar energy input since 1978. TSIS-1 sensors advance previous measurements, enabling scientists to study the sun's natural influence on Earth's ozone layer, atmospheric circulation, clouds, and ecosystems. These observations are essential for a scientific understanding of the effects of solar variability on the Earth system. NASA Goddard Space Flight Center manages the project. The University of Colorado's Laboratory for Atmospheric and Space Physics (LASP) built both instruments and provides mission operations. The International Space Station carries TSIS-1. TSIS-1 makes two key measurements: total solar irradiance, or TSI, the sun's total energy input into Earth, and solar spectral irradiance (SSI), the distribution of the sun's energy input across ultraviolet, visible, and infrared wavelengths of light. TSI measurements are needed to quantify the solar variations in the total amount of energy input to the Earth. SSI measurements are also vital because different wavelengths of light are absorbed by different parts of the atmosphere. NASA's Total and Spectral solar Irradiance Sensor, or TSIS-1, will measure the total amount of solar energy input to Earth as well as the distribution of The Sun's energy input across a wide range of wavelengths. In this animation we see how various wavelengths of light are partially reflected into space at different places in the column of atmosphere above the ground. The sensors of TSIS-1, the Total Irradiance Monitor (TIM) and the Spectral Irradiance Monitor (SIM), are significantly improved versions of sensors included on NASA’s Solar Radiation and Climate Experiment (SORCE) mission launched in 2003. Both sensors are more accurate and more precise than their predecessors. Earth's energy budget is a metaphor for the delicate equilibrium between energy received from the Sun versus energy radiated back out in to space. Research into precise details of Earth's energy budget is vital for understanding how the planet's climate may be changing, as well as variabilities in solar energy output. NASA’s (The Clouds and the Earth's Radiant Energy System) CERES and NASA's Total and Spectral solar Irradiance Sensor (TSIS-1), missions play key roles in our continued understanding of Earth’s Energy Budget.NASA’s TSIS helps scientists keep a close watch on the sun’s energy input to Earth. Various satellites have captured a continuous record of this solar energy input since 1978. TSIS-1 sensors advance previous measurements, enabling scientists to study the sun's natural influence on Earth's ozone layer, atmospheric circulation, clouds, and ecosystems. These observations are essential for a scientific understanding of the effects of solar variability on the Earth system. TSIS-1 makes two key measurements: total solar irradiance, or TSI, the sun's total energy input into Earth, and solar spectral irradiance (SSI), the distribution of the sun's energy input across ultraviolet, visible, and infrared wavelengths of light. TSI measurements are needed to quantify the solar variations in the total amount of energy input to the Earth. SSI measurements are also vital because different wavelengths of light are absorbed by different parts of the atmosphere.For more than 20 years, NASA Langley's CERES (System) instruments have measured the solar energy reflected by Earth, the heat the planet emits, and the role of clouds in that process. The final CERES Flight Model, CERES FM6 launched aboard NOAA’s JPSS-1 in Fall 2017. CERES FM6 contributes to an already extensive CERES dataset that helps scientists validate models that calculate the effect of clouds on planetary heating and cooling. The same data can also be helpful for improving near-term, seasonal forecasts influenced by weather events such as El Niño and La Niña. El Niño and La Niña are weather patterns that develop when ocean temperatures fluctuate between warm and cool phases in the Equatorial Pacific Ocean. Built by Northrop Grumman and managed by Langley, CERES FM6 joins five other CERES instruments orbiting the planet on three other satellites.NASA Goddard Space Flight Center manages the TSIS-1 project. The University of Colorado's Laboratory for Atmospheric and Space Physics (LASP) built both instruments and provides mission operations. The International Space Station carries TSIS-1.Earth's energy budget is a metaphor for the delicate equilibrium between energy received from the Sun versus energy radiated back out in to space. Research into precise details of Earth's energy budget is vital for understanding how the planet's climate may be changing, as well as variabilities in solar energy output. NASA’s (The Clouds and the Earth's Radiant Energy System) CERES and NASA's Total and Spectral solar Irradiance Sensor (TSIS-1), missions play key roles in our continued understanding of Earth’s Energy Budget.NASA’s TSIS helps scientists keep a close watch on the sun’s energy input to Earth. Various satellites have captured a continuous record of this solar energy input since 1978. TSIS-1 sensors advance previous measurements, enabling scientists to study the sun's natural influence on Earth's ozone layer, atmospheric circulation, clouds, and ecosystems. These observations are essential for a scientific understanding of the effects of solar variability on the Earth system. TSIS-1 makes two key measurements: total solar irradiance, or TSI, the sun's total energy input into Earth, and solar spectral irradiance (SSI), the distribution of the sun's energy input across ultraviolet, visible, and infrared wavelengths of light. TSI measurements are needed to quantify the solar variations in the total amount of energy input to the Earth. SSI measurements are also vital because different wavelengths of light are absorbed by different parts of the atmosphere.For more than 20 years, NASA Langley's CERES (System) instruments have measured the solar energy reflected by Earth, the heat the planet emits, and the role of clouds in that process. The final CERES Flight Model, CERES FM6 launched aboard NOAA’s JPSS-1 in Fall 2017. CERES FM6 contributes to an already extensive CERES dataset that helps scientists validate models that calculate the effect of clouds on planetary heating and cooling. The same data can also be helpful for improving near-term, seasonal forecasts influenced by weather events such as El Niño and La Niña. El Niño and La Niña are weather patterns that develop when ocean temperatures fluctuate between warm and cool phases in the Equatorial Pacific Ocean. Built by Northrop Grumman and managed by Langley, CERES FM6 joins five other CERES instruments orbiting the planet on three other satellites.NASA Goddard Space Flight Center manages the TSIS-1 project. The University of Colorado's Laboratory for Atmospheric and Space Physics (LASP) built both instruments and provides mission operations. The International Space Station carries TSIS-1. Related pages
Flying Around The Eclipse Shadow
June 21st, 2017
Read moreA view of the Moon's shadow during the August 21, 2017 eclipse from both the night and day sides of the Earth. This visualization combines the views from several previous visualizations (#4390, #4321, and #4314) to create a continuous camera flight from the night side of the Earth to the day side, showing the relationship of the Earth, Moon, and Sun during the August 21, 2017 eclipse. It shows the direction of the Moon's motion and the Earth's rotation, the complete path of the umbra from the moment it touches down on the Earth until the moment it departs, and the true scale of the Earth-Moon system. For More InformationSee [eclipse2017.nasa.gov](eclipse2017.nasa.gov) Related pages
2017 Solar Eclipse from L1
May 22nd, 2016
Read moreThe August 21, 2017 total solar eclipse as seen from a satellite in orbit around L1, a point about 1.5 million kilometers from Earth in the direction of the Sun. A number of satellites will be watching the August 21, 2017 total solar eclipse from space. One of them, the Deep Space Climate Observatory (DSCOVR) will see the eclipse from its orbit around L1, the Lagrange point located about 1.5 million kilometers from Earth along the Earth-Sun line. From this vantage point, DSCOVR's EPIC camera continuously images the full sunlit disk of the Earth.This animation simulates the view that EPIC will have of the 2017 eclipse. The shadow size and opacity are based on the eclipse obscuration, the fraction of the Sun's disk covered by the Moon. The bright spot near the equator is the reflection of the Sun on the water. The red streak shows the path of totality, the locations on the Earth where observers will see the Sun completely covered by the Moon.EPIC will see both the Moon's shadow and the Sun's reflection because DSCOVR's orbit takes it several degrees off both the Sun-Earth line and the Sun-Moon line. For the same reason, the Moon will not be in the frame. The animation places the virtual camera in a plausible position for DSCOVR. The actual position of the spacecraft at the time of the eclipse will be affected by adjustments to its orbit that may be made in the coming months.EPIC has already captured the total solar eclipse of March, 2016. Related pages
2017 Total Solar Eclipse in the U.S.
Sept. 9th, 2015
Read moreA view of the United States during the total solar eclipse of August 21, 2017, showing the umbra (black oval), penumbra (concentric shaded ovals), and path of totality (red) through or very near several major cities. A view of the United States during the total solar eclipse of August 21, 2017, showing the umbra (black oval), penumbra (concentric shaded ovals), and path of totality (red). This version omits the city and state names and the statistics display. A view of the United States during the total solar eclipse of August 21, 2017, showing the umbra (black oval), penumbra (concentric shaded ovals), and path of totality (red). This version includes images of the Sun showing its appearance in a number of locations, each oriented to the local horizon. On Monday, August 21, 2017, the Moon will pass in front of the Sun, casting its shadow across all of North America. This will be the first total solar eclipse visible in the contiguous United States in 38 years.The Moon's shadow can be divided into areas called the umbra and the penumbra. Within the penumbra, the Sun is only partially blocked, and observers experience a partial eclipse. The much smaller umbra lies at the very center of the shadow cone, and anyone there sees the Moon entirely cover the Sun in a total solar eclipse.In the animation, the umbra is the small black oval. The red streak behind this oval is the path of totality. Anyone within this path will see a total eclipse when the umbra passes over them. The much larger shaded bullseye pattern represents the penumbra. Steps in the shading denote different percentages of Sun coverage (eclipse magnitude), at levels of 90%, 75%, 50% and 25%. The yellow and orange contours map the path of the penumbra. The outermost yellow contour is the edge of the penumbra path. Outside this limit, no part of the Sun is covered by the Moon.The numbers in the lower left corner give the latitude and longitude of the center of the umbra as it moves eastward, along with the altitude of the Sun above the horizon at that point. Also shown is the duration of totality: for anyone standing at the center point, this is how long the total solar eclipse will last. Note that the duration varies from just 2 minutes on the West Coast to 2 minutes 40 seconds east of the Mississippi River.About AccuracyYou might think that calculating the circumstances of an eclipse would be, if not easy, then at least precise. If you do the math correctly, you’d expect to get exactly the same answers as everyone else. But the universe is more subtle than that. The Earth is neither smooth nor perfectly spherical, nor does it rotate at a perfectly constant, predictable speed. The Moon isn’t smooth, either, which means that the shadow it casts isn’t a simple circle. And our knowledge of the size of the Sun is uncertain by a factor of about 0.2%, enough to affect the duration of totality by several seconds.Everyone who performs these calculations will make certain choices to simplify the math or to precisely define an imperfectly known number. The choices often depend on the goals and the computing resources of the calculator, and as you'd expect, the results will differ slightly. You can get quite good results with a relatively simple approach, but it sometimes takes an enormous effort to get only slightly better answers.The following table lists some of the constants and data used for this animation.Earth radius6378.137 kmEarth flattening1 / 298.257 (the WGS 84 ellipsoid)Moon radius1737.4 km (k = 0.2723993)Sun radius696,000 km (959.634 arcsec at 1 AU)EphemerisDE 421Earth orientationearth_070425_370426_predict.bpc (ΔT corrected)Delta UTC68.184 seconds (TT – TAI + 36 leap seconds)A number of sources explain Bessel’s method of solar eclipse calculation, including chapter 9 of Astronomy on the Personal Computer by Oliver Montenbruck and Thomas Pflager and the eclipses chapter of The Explanatory Supplement to the Astronomical Almanac. The method was adapted to the routines available in NAIF's SPICE software library.The value for the radius of the Moon is slightly larger than the one used by Fred Espenak and slightly smaller than the one used by the Astronomical Almanac. The Sun radius is the one used most often, but see figure 1 in M. Emilio et al., Measuring the Solar Radius from Space during the 2003 and 2006 Mercury Transits for a sense of the uncertainty in this number.Both the elevations of locations on the Earth and the irregular limb of the Moon were ignored. The resulting small errors mostly affect the totality duration calculation, but they tend to cancel out—elevations above sea level slightly lengthen totality, while valleys along the lunar limb slightly shorten it. The effect on the rendered images is negligible (smaller than a pixel).Another minor complication that's ignored here is the difference between the Moon's center of mass (the position reported in the ephemeris) and its center of figure (the center of the disk as seen from Earth). These two centers don't exactly coincide because the Moon's mass isn't distributed evenly, but the difference is quite small, about 0.5 kilometers. Related pages