2017 Spring Equinox Live Shots
- Edited by:
- Michael Randazzo
- Produced by:
- Michelle Handleman
- View full credits
Movies
- eclipse_LS_Broll.mp4 (1280x720) [349.3 MB]
- eclipse_LS_Broll.webm (1280x720) [33.4 MB]
Images
- Screen_Shot_2017-03-20_at_5.23.14_AM_print.jpg (1024x536) [56.1 KB]
- Screen_Shot_2017-03-20_at_5.23.14_AM_print_print.jpg (1024x536) [56.4 KB]
- Screen_Shot_2017-03-20_at_5.23.14_AM.png (2382x1248) [2.0 MB]
- Screen_Shot_2017-03-20_at_5.23.14_AM_print_thm.png (80x40) [5.8 KB]
- Screen_Shot_2017-03-20_at_5.23.14_AM_print_web.png (320x167) [53.5 KB]
- Screen_Shot_2017-03-20_at_5.23.14_AM_print_searchweb.png (320x180) [58.5 KB]
B-roll that corresponds with the following suggested questions:
1. What is an equinox?
2. There is an exciting event happening this year: a total solar eclipse! When is this happening?
3. NASA will be doing some pretty cool science during the eclipse. How is NASA using the eclipse to study the sun and Earth?
4. How do eclipses help us find planets orbiting other stars?
5. Where can we learn more?
NASA Satellites Ready When Stars and Planets Align.
Dance of the Solar System is the First Solar Event of 2017
Stay Tuned for the Big Event of 2017, the August Solar Eclipse!
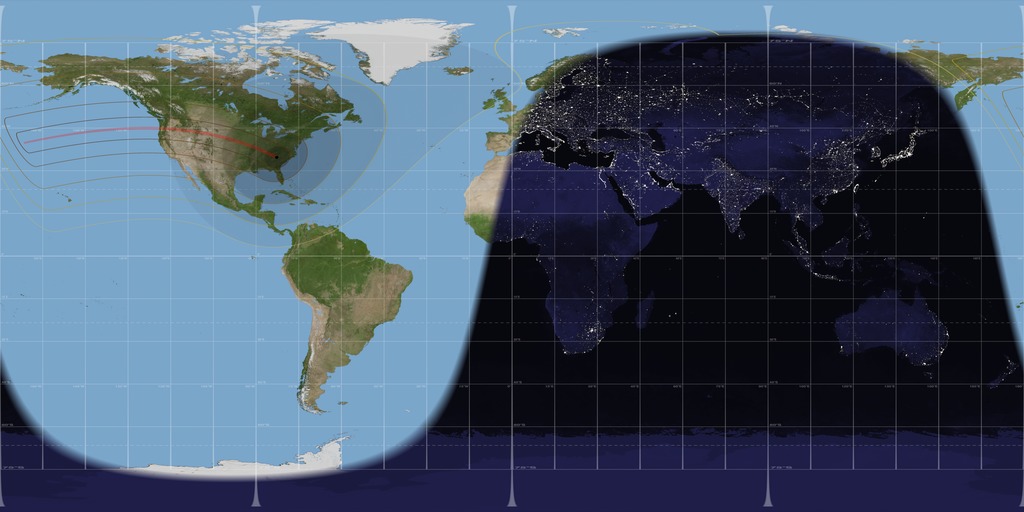
It may not feel like it this week in parts of the country, but spring begins in just a few days. March 20 kicks off the first day of astronomical spring in the Northern Hemisphere. On March 20, the day of the spring Equinox, the sun will pass directly over the Earth’s equator, giving the entire planet equal hours of day and night. This is the seasonal marker in Earth’s orbit around the sun when daylight hours begin to get longer than night.
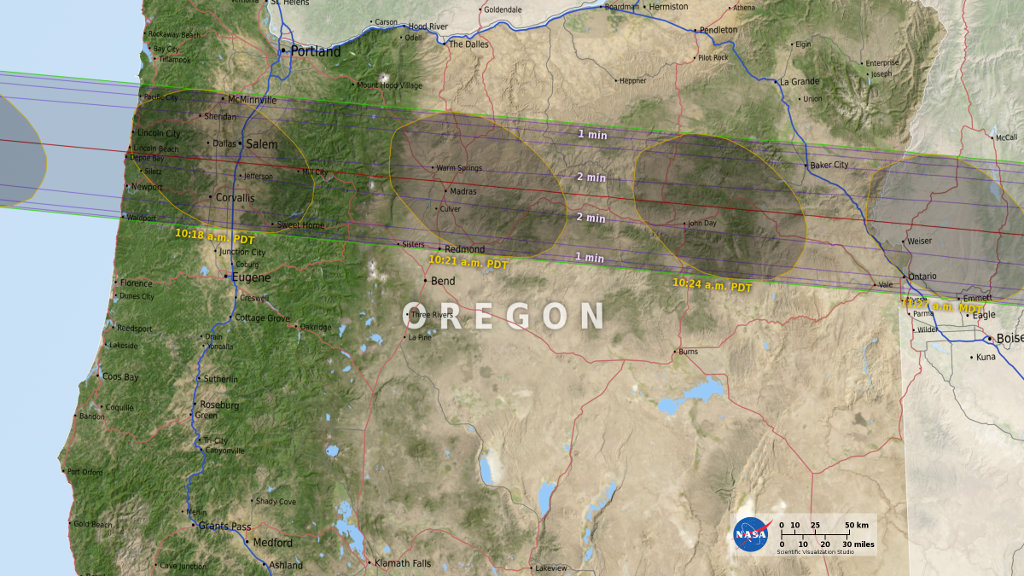
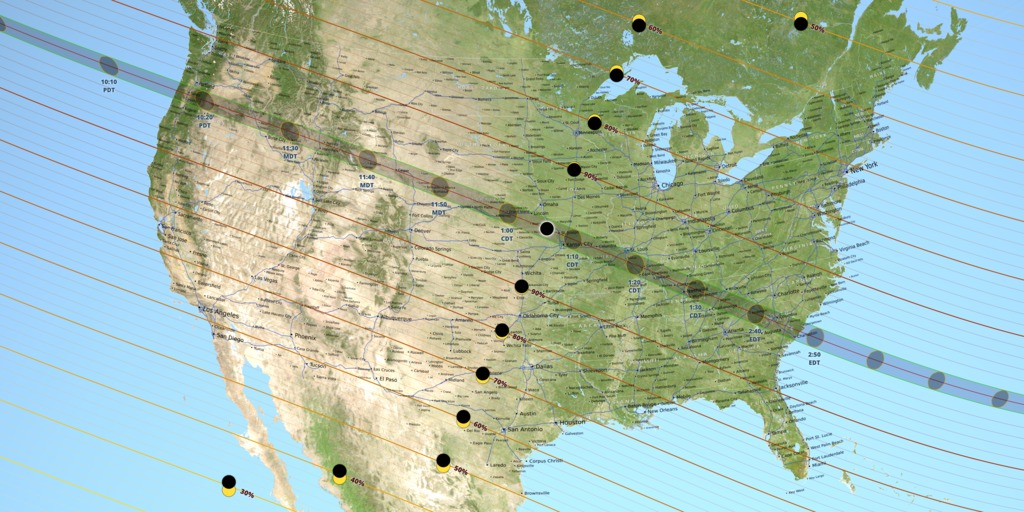
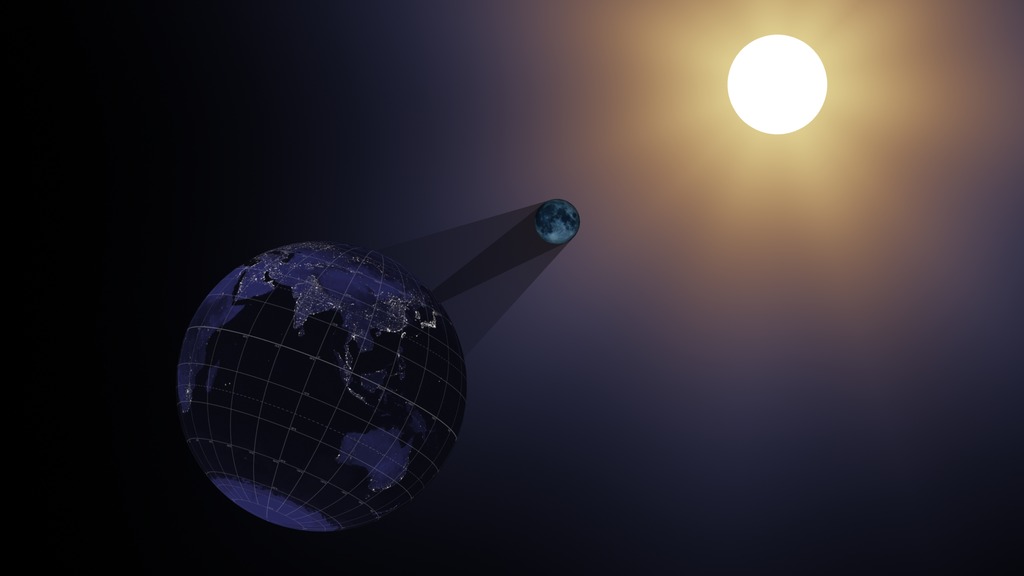
This dance of the solar system is just one celestial event we’ll see this year. On August 21 all 50 states in the U.S. will be in prime position to see a partial or even a total solar eclipse, which happens when the moon is in perfect position to blot out the sun’s bright disk. The last time the U.S. saw a coast-to-coast solar eclipse was in 1918! The path of totality runs from Oregon to South Carolina.
NASA will lead an unprecedented science initiative during the eclipse that will draw on the collaboration of the public to help collect images, data and even temperature readings from across the nation during the hour-and-a-half it takes to cross the continent.
NASA scientists are available on Monday, March 20 from 6:00 a.m. – 11:30 a.m. EDT to help your viewers ring in the new season and talk about the big solar event this August.
***To book a window contact*** Michelle Handleman / michelle.z.handleman@nasa.gov/ 301-286-0918
HD Satellite Coordinates for G17-K18Upper: Galaxy 17 Ku-band Xp 18 Slot Upper| 91.0 ° W Longitude | DL 12069.0 MHz | Vertical Polarity | QPSK/DVB-S | FEC 3/4 | SR 13.235 Mbps | DR 18.2954 MHz | HD 720p | Format MPEG2 | Chroma Level 4:2:0 | Audio Embedded
Suggested Questions:
1. What is an equinox?
2. There is an exciting event happening this year: a total solar eclipse! When is this happening?
3. NASA will be doing some pretty cool science during the eclipse. How is NASA using the eclipse to study the sun and Earth?
4. How do eclipses help us find planets orbiting other stars?
5. Where can we learn more?
Live Shot Details:
Location: NASA’s Goddard Space Flight Center/Greenbelt, Maryland
Scientists:
Dr. Alex Young/ NASA Scientist
Dr. Yari Collado-Vega / NASA Scientist [Interviews in Spanish]
Dr. Nicholeen Viall / NASA Scientist
Video: NASA will roll all insert videos during live interviews. If needed, stations can roll a clean feed of all video at 5:45 a.m. EDT on March 20, at the above listed satellite.
Soundbites from NASA Scientist Dr. Alex Young. Includes TEXT transcript file.
Dr. Alex Young, NASA Scientist Social Media Teaser
Movies
- Alex_Young_Equinox_LS.mov (1280x720) [3.4 GB]
- Alex_Young_Equinox_LS.mp4 (1280x720) [409.0 MB]
- Alex_Young_Equinox_LS.webmhd.webm (1280x720) [53.1 MB]
Captions
- Alex_Young_Equinox_LS.en_US.srt [5.3 KB]
- Alex_Young_Equinox_LS.en_US.vtt [5.1 KB]
Images
- Alex_Young_Equinox_LS.00001_print.jpg (1024x576) [104.4 KB]
Dr. Alex Young, NASA Scientist
Dr. Nicki Viall, NASA Scientist
For More Information
Credits
Please give credit for this item to:
NASA's Goddard Space Flight Center
Editor
- Michael Randazzo (AIMM) [Lead]
Producers
- Michelle Handleman (KBRwyle) [Lead]
- Clare Skelly (NASA/GSFC)
Series
This visualization can be found in the following series:Related pages
August 21, 2017 Total Solar Eclipse Path for Spherical Displays
Feb. 14th, 2017
Read moreA map-like view of the Earth during the total solar eclipse of August 21, 2017, showing the umbra (black oval), penumbra (concentric shaded ovals), and the path of totality (red). This equirectangular projection is suitable for spherical displays and for spherical mapping in 3D animation software. On Monday, August 21, 2017, the Moon will pass in front of the Sun, casting its shadow across all of North America. This will be the first total solar eclipse visible in the contiguous United States in 38 years.The Moon's shadow can be divided into areas called the umbra and the penumbra. Within the penumbra, the Sun is only partially blocked, and observers experience a partial eclipse. The much smaller umbra lies at the very center of the shadow cone, and anyone there sees the Moon entirely cover the Sun in a total solar eclipse.In the animation, the umbra is the small black oval. The red streak behind this oval is the path of totality. Anyone within this path will see a total eclipse when the umbra passes over them. The much larger shaded bullseye pattern represents the penumbra. Steps in the shading denote different percentages of Sun coverage (eclipse magnitude), at levels of 90%, 75%, 50% and 25%. The yellow and orange contours map the path of the penumbra. The outermost yellow contour is the edge of the penumbra path. Outside this limit, no part of the Sun is covered by the Moon.The animation covers the four hours from 16:25:40 UTC to 20:25:30 UTC with time steps of 10 seconds between frames. Related pages
SDO: Year 7
Feb. 11th, 2017
Read moreThe Solar Dynamics Observatory, or SDO, has now captured nearly seven years worth of ultra-high resolution solar footage. This time lapse shows that full run from two of SDO's instruments. The large orange sun is visible light captured by the Helioseismic and Magnetic Imager, or HMI. The smaller golden sun is extreme ultraviolet light from the Atmospheric Imaging Assembly, or AIA, and reveals some of the sun's atmosphere, the corona. Both appear at one frame every 12 hours. SDO's nearly unbroken run is now long enough to watch the rise and fall of the current solar cycle. The graph of solar activity shows the sunspot number, a measurement based on the number of individual spots and the number of sunspot groups. In this case, the line represents a smoothed 26-day average to more clearly show the overall trend.Music: "Web of Intrigue" from Killer TracksWatch this video on the NASA Goddard YouTube channel.Complete transcript available. Shortened version of the time lapse with the HMI visible sun only.Music: "Web of Intrigue" from Killer TracksComplete transcript available. The time lapse portion of the video only, with more detail related to the sunspot number. This version also shows the daily sunspot number as a numerical value and as a faint graph. SDO: Year 7 title still Our sun is ever-changing, and the Solar Dynamics Observatory has a front-row seat. On Feb. 11, 2010, NASA launched the Solar Dynamics Observatory, also known as SDO. SDO keeps a constant eye on the sun, helping us track everything from sunspots to solar flares to other types of space weather that can have an impact on Earth. For instance, solar activity is behind the aurora, one of Earth’s most dazzling natural events. The sun’s activity rises and falls in a pattern that lasts about 11 years on average. This is called the solar cycle. After seven years in space, SDO has had a chance to do what few other satellites have been able to do – watch the sun for the majority of a solar cycle in 11 types of light. This video shows two. Related pages
2017 Eclipse State Maps
Feb. 5th, 2017
Read moreOregon Montana Idaho Wyoming Nebraska Iowa Kansas Missouri Illinois Kentucky Tennessee Georgia North Carolina South Carolina The path of totality passes through 14 states during the total solar eclipse on August 21, 2017. A map of each of these states, created for NASA's official eclipse 2017 website, is presented here. Except for Montana, each map is 8 inches wide (or high) at 300 DPI. The umbra is shown at 3-minute intervals, with times in the local time zone at the umbra center. The duration of totality is outlined in 30-second increments. Interstate highways are blue, other major roads are red, and secondary roads are gray.Some sources list only 12 states for this eclipse, but in fact the path of totality also grazes the southwestern borders of both Montana and Iowa. The Montana part of the path is in a roadless area at the southern end of the Beaverhead Mountains, a range that defines sections of both the Montana-Idaho border and the Continental Divide. The Iowa part of the path is west of Interstate 29 near Hamburg, south of 310 Street, and bounded on the west by the Missouri River. It includes the Lower Hamburg Bend Wildlife Management Area. For More InformationSee [http://eclipse2017.nasa.gov](http://eclipse2017.nasa.gov) Related pages
2017 Total Solar Eclipse Map and Shapefiles
Dec. 12th, 2016
Read moreA map of the United States showing the path of totality for the August 21, 2017 total solar eclipse. This is version 2 of the map, available at both 5400 × 2700 and 10,800 × 5400. A global map of the path of totality for the August 21, 2017 total solar eclipse. A map of the United States showing the path of totality for the August 21, 2017 total solar eclipse. The shapes of the umbra and penumbra, provided in ESRI shapefile format suitable for use in GIS software. The umbra, path, and center line in shapefile format for use in GIS software. This shapefile set is intended for larger scale (higher resolution) mapping. The preview image shows the umbra at 90-second intervals as it passes through Nebraska. Map of the 1918 total solar eclipse, from the American Ephemeris and Nautical Almanac for the Year 1918. This is a scan from the copy of the almanac held by the NASA Goddard library. Map of the 1979 total solar eclipse, from the American Ephemeris and Nautical Almanac. This is a scan from Ernie Wright's personal copy of U.S. Naval Observatory Circular No. 157. This map of the United States shows the path of the Moon's umbral shadow — the path of totality — during the total solar eclipse on August 21, 2017, as well as the obscuration (the fraction of the Sun's area covered by the Moon) in places outside the umbral path. Features include state boundaries, major highways, and 833 place names. At 18" × 9" (45 × 22.5 cm), the scale of the map is approximately 1:10,000,000.The umbra is shown at 10-minute intervals. Umbra shapes within U.S. time zones are labeled in local time. To read about the reason the shapes aren't smooth ovals, go here.The map uses a number of NASA data products. The land color is based on Blue Marble Next Generation, a global mosaic of MODIS images assembled by NASA's Earth Observatory. Elevations are from SRTM, a radar instrument flown on Space Shuttle Endeavour during the STS-99 mission. Lunar topography, used for precise shadow calculations, is from NASA LRO laser altimetry and JAXA Kaguya stereo imaging. Planetary positions are from the JPL DE421 ephemeris. The lunar limb profile and eclipse calculations are by the visualizer. ShapefilesThe map was rendered in animation software, but maps are more typically created using GIS tools and vector datasets. A set of shapefiles describing the umbra and penumbra extents is provided below in two Zip archives, one for global, U.S., and statewide maps and the other for county and city scale mapping. eclipse2017_shapefiles.zip contains the following nine shapefiles:penum17 contains the contours for maximum obscuration at 90%, 75%, 50%, 25% and the penumbra edge at 0%.penum17_1m contains a time sequence of penumbra outlines at 1-minute intervals from 17:00 to 19:15 UTC, for 95% to 75% obscuration in 5% steps.upath17 and w_upath17 contain the path of totality. The w_ version is the complete (world) path, at somewhat reduced resolution, while the other is a high-resolution version of the path limited to the 96 degrees of longitude centered on the U.S.umbra17 and w_umbra17 contain umbra shapes spaced at 10-minute intervals, again at U.S. and world (w_) scales.w_umbra17_1m contains umbra shapes at 1-minute intervals from 16:49 to 20:02 UTC, covering the complete timespan of totality.center17 and w_center17 contain the center line.The projection for all of these shapefiles is WGS84, latitude-longitude, in degrees. A minimal .PRJ file reflecting this projection is included for each shape. eclipse2017_shapefiles_1s.zip is intended for larger-scale (higher resolution) mapping. It contains the following shapefiles:umbra17_1s contains 6000 umbra shapes at one-second intervals from 17:12 to 18:52 UTC. These are high-resolution shapes with roughly 100-meter precision. The attributes for each shape include both a string representation of the UTC time and an integer containing the number of seconds past midnight of eclipse day.upath17_1s contains the path of totality, limited to the extent of the 6000 umbra shapes, roughly the 54 degrees of longitude between 130°W and 76°W. The shape was calculated at a precision of 250 meters.ucenter17_1s contains the center line as a polyline with points at one-second intervals.durations17_1s contains shapefiles for duration of totality at 30-second intervals. As with the path, these shapes are truncated and invalid at the ends.Past Eclipses The last time a total solar eclipse spanned the contiguous United States was in 1918. The path of totality entered the U.S. through the southwest corner of Washington state and passed over Denver, Jackson (Mississippi) and Orlando before exiting the country at the Atlantic coast of Florida. Prior to 2017, the most recent total solar eclipse in the Lower 48 was in 1979. Totality was visible in Washington, Oregon, Idaho, Montana, and North Dakota, as well as parts of Canada and Greenland. The author saw this eclipse in Winnipeg, Manitoba. For More InformationSee [http://eclipse2017.nasa.gov](http://eclipse2017.nasa.gov) Related pages
Visualizing the 2017 All-American Eclipse
April 14th, 2016
Read moreComplete transcript available.Watch this video on the NASAgovVideo YouTube channel.This video is also available on our YouTube channel. On August 21, 2017, the Earth will cross the shadow of the Moon, creating a total solar eclipse. Eclipses happen about every six months, but this one is special. For the first time in almost 40 years, the path of the Moon's shadow passes through the continental United States.The video features several visualizations of this event. From behind the Earth, we see the night sides of both the Earth and Moon and the umbral and penumbral shadow cones projecting from the Moon. We then see the tilted orbit of the Moon and the long, thin shadow cones striking the Earth. In the view from behind the Moon, we see the daylit far side of the Moon and the western hemisphere of the Earth, and from this vantage point, the outline of the shadow on the Earth is circular.Most of the video shows a close-up view of the U.S. during the eclipse. Everyone there will see the Moon at least partially block the Sun, but those along the path of totality, shown in red, will see the Moon block the Sun entirely. The appearance of the Sun throughout the eclipse is shown for a number of locations in North America, with each Sun image oriented to the local horizon.Some of the visualizations use extremely long telephoto lenses to visually compress the scene, but all of them are geometrically accurate and true to scale. Go here for more details about the calculations and for links to each of the visualizations. Related pages
SDO: Year 6
Feb. 12th, 2016
Read moreThis ultra-high definition (3840x2160) video shows the sun in the 171 angstrom wavelength of extreme ultraviolet light. It covers a time period of January 2, 2015 to January 28, 2016 at a cadence of one frame every hour, or 24 frames per day. This timelapse is repeated with narration by solar scientist Nicholeen Viall and contains close-ups and annotations. 171 angstrom light highlights material around 600,000 Kelvin and shows features in the upper transition region and quiet corona of the sun. The video is available to download here at 59.94 frames per second, double the rate YouTube currently allows for UHD content. The music is titled "Tides" and is from Killer Tracks.Watch this video on the NASA Goddard YouTube channel.Complete transcript available. This image, and the one at the top, is a composite of 23 separate images spanning the period of January 11, 2015 to January 21, 2016. It uses the SDO AIA wavelength of 171 angstroms and reveals the zones on the sun where active regions are most common during this part of the solar cycle. There are wallpapers sized for some phones and tablets available to download here.Credit: NASA's Goddard Space Flight Center/SDO/S. Wiessinger This ultra-high definition (3840x2160) video shows the sun in the 171 angstrom wavelength of extreme ultraviolet light. It covers a time period of January 2, 2015 to January 28, 2016 at a cadence of one frame every hour, or 24 frames per day. The video is available to download here at 59.94 frames per second, double the rate YouTube currently allows for UHD content.Complete transcript available. The sun is always changing and NASA's Solar Dynamics Observatory is always watching. Launched on Feb. 11, 2010, SDO keeps a 24-hour eye on the entire disk of the sun, with a prime view of the graceful dance of solar material coursing through the sun's atmosphere, the corona. SDO's sixth year in orbit was no exception. This video shows that entire sixth year--from Jan. 1, 2015 to Jan. 28, 2016 as one time-lapse sequence. At full quality, this video is ultra-high definition 3840x2160 and 59.94 frames per second. Each frame represents 1 hour.SDO's Atmospheric Imaging Assembly (AIA) captures a shot of the sun every 12 seconds in 10 different wavelengths. The images shown here are based on a wavelength of 171 angstroms, which is in the extreme ultraviolet range and shows solar material at around 600,000 Kelvin (about 1 million degrees F.) In this wavelength it is easy to see the sun's 25-day rotation.During the course of the video, the sun subtly increases and decreases in apparent size. This is because the distance between the SDO spacecraft and the sun varies over time. The image is, however, remarkably consistent and stable despite the fact that SDO orbits Earth at 6,876 mph and the Earth orbits the sun at 67,062 miles per hour.Scientists study these images to better understand the complex electromagnetic system causing the constant movement on the sun, which can ultimately have an effect closer to Earth, too: Flares and another type of solar explosion called coronal mass ejections can sometimes disrupt technology in space. Moreover, studying our closest star is one way of learning about other stars in the galaxy. NASA's Goddard Space Flight Center in Greenbelt, Maryland. built, operates, and manages the SDO spacecraft for NASA's Science Mission Directorate in Washington, D.C. For More InformationSee [http://sdo.gsfc.nasa.gov/](http://sdo.gsfc.nasa.gov/) Related pages
SDO: Year 5
Feb. 11th, 2015
Read moreHighlights from the Solar Dynamics Observatory's five years of watching the sun.The music is "Expanding Universe" and "Facing the Unknown" both from Killer Tracks.Watch this video on the NASA Goddard YouTube channel.For complete transcript, click here.Information about the individual clips used in this video is here.Credit: NASA's Goddard Space Flight Center/SDO Large square version of the SDO 5 Year mosaic.Credit: NASA's Goddard Space Flight Center/SDO February 11, 2015 marks five years in space for NASA's Solar Dynamics Observatory, which provides incredibly detailed images of the whole sun 24 hours a day. Capturing an image more than once per second, SDO has provided an unprecedentedly clear picture of how massive explosions on the sun grow and erupt ever since its launch on Feb. 11, 2010. The imagery is also captivating, allowing one to watch the constant ballet of solar material through the sun's atmosphere, the corona. In honor of SDO's fifth anniversary, NASA has released a video showcasing highlights from the last five years of sun watching. Watch the movie to see giant clouds of solar material hurled out into space, the dance of giant loops hovering in the corona, and huge sunspots growing and shrinking on the sun's surface. The imagery is an example of the kind of data that SDO provides to scientists. By watching the sun in different wavelengths – and therefore different temperatures – scientists can watch how material courses through the corona, which holds clues to what causes eruptions on the sun, what heats the sun's atmosphere up to 1,000 times hotter than its surface, and why the sun's magnetic fields are constantly on the move.Five years into its mission, SDO continues to send back tantalizing imagery to incite scientists' curiosity. For example, in late 2014, SDO captured imagery of the largest sun spots seen since 1995 as well as a torrent of intense solar flares. Solar flares are bursts of light, energy and X-rays. They can occur by themselves or can be accompanied by what's called a coronal mass ejection, or CME, in which a giant cloud of solar material erupts off the sun, achieves escape velocity and heads off into space. In this case, the sun produced only flares and no CMEs, which, while not unheard of, is somewhat unusual for flares of that size. Scientists are looking at that data now to see if they can determine what circumstances might have led to flares eruptions alone. Goddard built, operates and manages the SDO spacecraft for NASA's Science Mission Directorate in Washington, D.C. SDO is the first mission of NASA's Living with a Star Program. The program's goal is to develop the scientific understanding necessary to address those aspects of the sun-Earth system that directly affect our lives and society. For More InformationSee [http://www.nasa.gov/content/goddard/videos-highlight-sdos-fifth-anniversary/](http://www.nasa.gov/content/goddard/videos-highlight-sdos-fifth-anniversary/) Related pages
SDO Sees Fiery Looping Rain on the Sun
Feb. 20th, 2013
Read moreOn July 19, 2012, an eruption occurred on the sun that produced a moderately powerful solar flare and a dazzling magnetic display known as coronal rain. Hot plasma in the corona cooled and condensed along strong magnetic fields in the region. Magnetic fields, are invisible, but the charged plasma is forced to move along the lines, showing up brightly in the extreme ultraviolet wavelength of 304 angstroms, and outlining the fields as it slowly falls back to the solar surface.Music: "Thunderbolt" by Lars Leonhard, courtesy of artist.For complete transcript, click here. Eruptive events on the sun can be wildly different. Some come just with a solar flare, some with an additional ejection of solar material called a coronal mass ejection (CME), and some with complex moving structures in association with changes in magnetic field lines that loop up into the sun's atmosphere, the corona. On July 19, 2012, an eruption occurred on the sun that produced all three. A moderately powerful solar flare exploded on the sun's lower right hand limb, sending out light and radiation. Next came a CME, which shot off to the right out into space. And then, the sun treated viewers to one of its dazzling magnetic displays — a phenomenon known as coronal rain. Over the course of the next day, hot plasma in the corona cooled and condensed along strong magnetic fields in the region. Magnetic fields, themselves, are invisible, but the charged plasma is forced to move along the lines, showing up brightly in the extreme ultraviolet wavelength of 304 angstroms, which highlights material at a temperature of about 50,000 Kelvin. This plasma acts as a tracer, helping scientists watch the dance of magnetic fields on the sun, outlining the fields as it slowly falls back to the solar surface. The footage in this video was collected by the Solar Dynamics Observatory's AIA instrument. SDO collected one frame every 12 seconds, and the movie plays at 30 frames per second, so each second in this video corresponds to 6 minutes of real time. The video covers 12:30 a.m. EDT to 10:00 p.m. EDT on July 19, 2012.Watch this video on YouTube. For More InformationSee [http://www.nasa.gov/mission_pages/sdo/news/coronal-rain.html](http://www.nasa.gov/mission_pages/sdo/news/coronal-rain.html) Related pages
Heliospheric Future: Parker Solar Probe (formerly Solar Probe Plus) & Solar Orbiter
Sept. 19th, 2012
Read moreThis movie illustrates the planned trajectories for Solar Orbiter and Parker Solar Probe. Opening view of the inner solar system, 2016. Solar Orbiter leaves Earth and gets a gravity-assist from Venus. Parker Solar Probe enters an elliptical solar orbit. Parker Solar Probe uses repeated Venus flybys to move its perihelion closer to the Sun. Solar Orbiter & Parker Solar Probe approach their final orbits. An End-of-Mission configuration. Two future missions scheduled for detailed studies of the Sun and solar atmosphere are Parker Solar Probe and Solar Orbiter.Parker Solar Probe will move in a highly-elliptical orbit, using gravity-assists from Venus to move it closer to the Sun with each pass. The goal is to get the spacecraft to fly through the corona at a distance of 9.5 solar radii.Solar Orbiter will use Earth and Venus gravity assists to move into a relatively circular orbit, inside the orbit of Mercury for monitoring the Sun. Related pages