August 21, 2017 Total Solar Eclipse Path for Spherical Displays
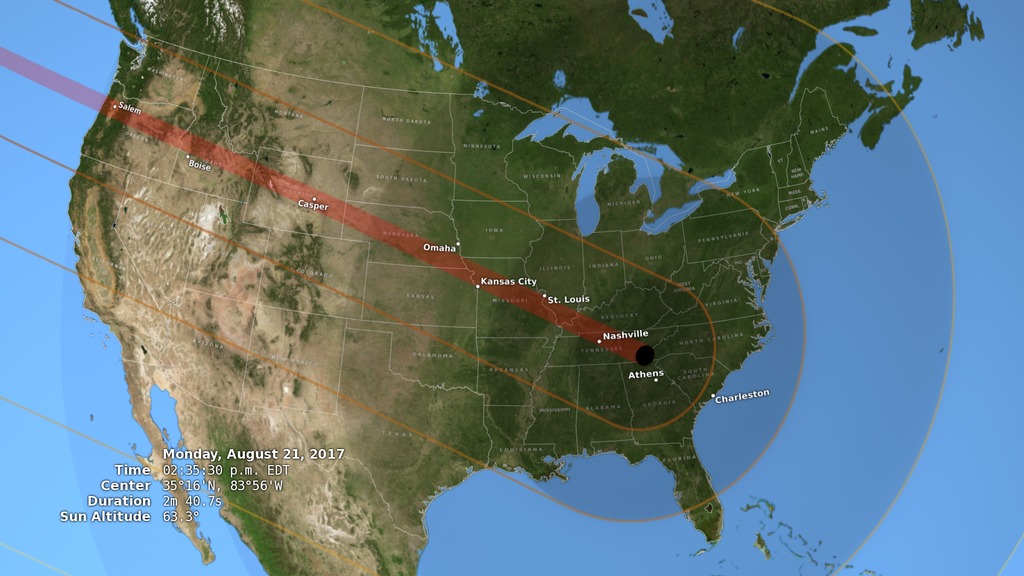
A map-like view of the Earth during the total solar eclipse of August 21, 2017, showing the umbra (black oval), penumbra (concentric shaded ovals), and the path of totality (red). This equirectangular projection is suitable for spherical displays and for spherical mapping in 3D animation software.
On Monday, August 21, 2017, the Moon will pass in front of the Sun, casting its shadow across all of North America. This will be the first total solar eclipse visible in the contiguous United States in 38 years.
The Moon's shadow can be divided into areas called the umbra and the penumbra. Within the penumbra, the Sun is only partially blocked, and observers experience a partial eclipse. The much smaller umbra lies at the very center of the shadow cone, and anyone there sees the Moon entirely cover the Sun in a total solar eclipse.
In the animation, the umbra is the small black oval. The red streak behind this oval is the path of totality. Anyone within this path will see a total eclipse when the umbra passes over them. The much larger shaded bullseye pattern represents the penumbra. Steps in the shading denote different percentages of Sun coverage (eclipse magnitude), at levels of 90%, 75%, 50% and 25%. The yellow and orange contours map the path of the penumbra. The outermost yellow contour is the edge of the penumbra path. Outside this limit, no part of the Sun is covered by the Moon.
The animation covers the four hours from 16:25:40 UTC to 20:25:30 UTC with time steps of 10 seconds between frames.
Credits
Please give credit for this item to:
NASA's Scientific Visualization Studio
-
Visualizer
-
Ernie Wright
(USRA)

-
Ernie Wright
(USRA)
Series
This page can be found in the following series:Datasets used
-
BMNG (Blue Marble: Next Generation) [Terra and Aqua: MODIS]
ID: 508Credit: The Blue Marble data is courtesy of Reto Stockli (NASA/GSFC).
This dataset can be found at: http://earthobservatory.nasa.gov/Newsroom/BlueMarble/
See all pages that use this dataset -
DE421 (JPL DE421)
ID: 752Planetary ephemerides
This dataset can be found at: http://ssd.jpl.nasa.gov/?ephemerides#planets
See all pages that use this dataset
Note: While we identify the data sets used on this page, we do not store any further details, nor the data sets themselves on our site.
Related
- ID: 12625
- ID: 12535
 Produced Video
Alternate Versions
- ID: 4314
 Visualization
Release date
This page was originally published on Wednesday, February 15, 2017.
This page was last updated on Sunday, February 2, 2025 at 10:31 PM EST.