ABoVE campaign videos
The Arctic Boreal and Vulnerability Experiment (ABoVE) covers 2.5 million square miles of tundra, forests, permafrost and lakes in Alaska and Northwestern Canada. ABoVE scientists are using satellites and aircraft to study this formidable terrain as it changes in a warming climate. Remote sensing by itself is not enough to understand the whole picture, so teams of researchers will go out into the field to gather data. With support from NASA’s Terrestrial Ecology Program, ABoVE researchers investigate questions about the role of climate in wildfires, thawing permafrost, wildlife migration habits, insect outbreaks and more.
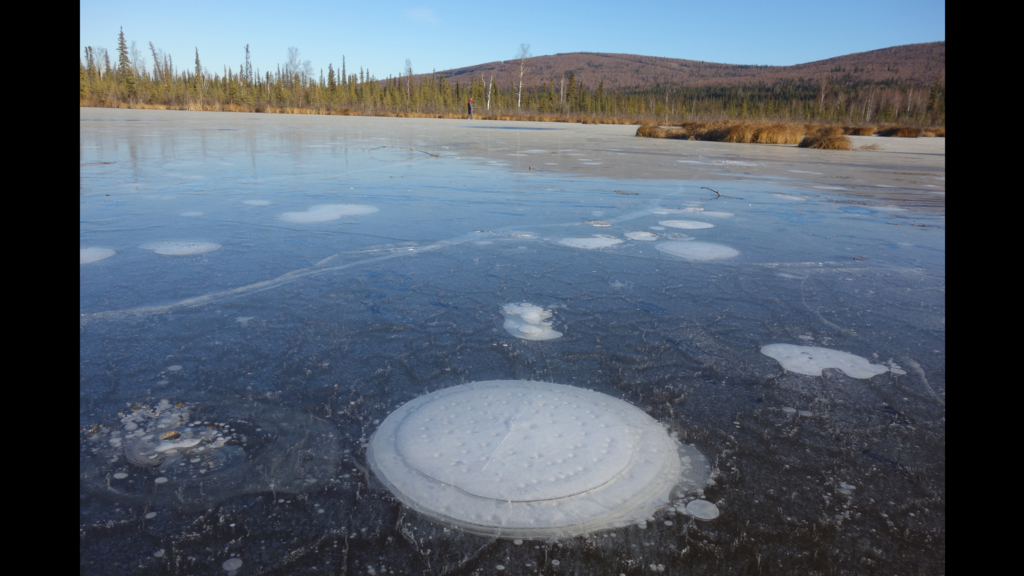
Bubbles, bubbles, and more bubbles, in a steady stream. Many lakes in the boreal regions of Alaska are emitting methane, the product of decomposing organic matter left over from the Ice Age. Thawing permafrost has caused areas of land to slump and fill up with water, creating these bodies of water called thermokarst lakes. The water then exacerbates the thawing, expanding the size of the lake and producing even more methane. In the early cold season, ice covers the lakes and traps methane in large pockets just beneath the surface. University of Alaska Fairbanks scientists working as part of NASA’s Arctic boreal Vulnerability Experiment (ABoVE) find and measure the methane gas in these pockets seep-by-seep and lake-by-lake. ABoVE combines precise methane measurements from individual lakes with satellite data that can monitor lakes like these across the Arctic, to accurately model how much methane sub-lake seeps are adding to the atmosphere. For more on the bubbling lakes: https://blogs.nasa.gov/earthexpeditions/2016/08/23/mapping-methane-in-a-bubbling-arctic-lake/
Complete transcript available.
ABoVE scientist Chip Miller provides a brief introduction to the CARVE tower, which monitors the atmosphere all year round.
For more on the CARVE tower: https://blogs.nasa.gov/earthexpeditions/2016/07/14/tower-power-measuring-carbon-in-the-last-frontier/
Complete transcript available.
Credits
Please give credit for this item to:
NASA's Goddard Space Flight Center
-
Producer
- Jefferson Beck (USRA)
-
Writer
- Kate Ramsayer (Telophase)
-
Scientist
Series
This page can be found in the following series:Related
- ID: 12794
![Music: Wondrous Lands by Anthony Giordan [SACEM]](/vis/a010000/a012700/a012794/LARGE_MP4_ABoVE_Final_Wrap_large.00150_print.jpg) Produced Video
Produced Video
Used as a Source In
- ID: 14221
![Universal Production Music: Home To You by William Baxter Noon [PRS], Pluck Up Courage by John Griggs [PRS], Philip Michael Guyler [PRS], Wafer Thin by Adam Leslie Gock [APRA], Dinesh David Wicks [APRA], Mitchell Stewart [APRA], The Magpie's Pie by Quentin Bachelet [SACEM], Romain Sanson [SACEM], Ticking Tension by Quentin Bachelet [SACEM], Romain Sanson [SACEM], Reward Drawer by Ehren Ebbage [BMI] Additional images courtesy of Alaska Satellite Facility - University of Alaska FairbanksThis video can be freely shared and downloaded. While the video in its entirety can be shared without permission, some individual imagery provided by ASF is obtained through permission and may not be excised or remixed in other products. For more information on NASA’s media guidelines, visit https://www.nasa.gov/multimedia/guidelines/index.htmlComplete transcript available.](/vis/a010000/a014200/a014221/ABoVE_Title.jpg) Produced Video
Produced Video - ID: 13127
 Produced Video
 - ID: 13047
![Music: Coveted Jewels by Reuben James Cornell [PRS]Complete transcript available.](/vis/a010000/a013000/a013047/Bubbles_Still.png)
Release date
This page was originally published on Friday, August 26, 2016.
This page was last updated on Wednesday, May 3, 2023 at 1:48 PM EDT.