Why Do Raindrop Sizes Matter In Storms?
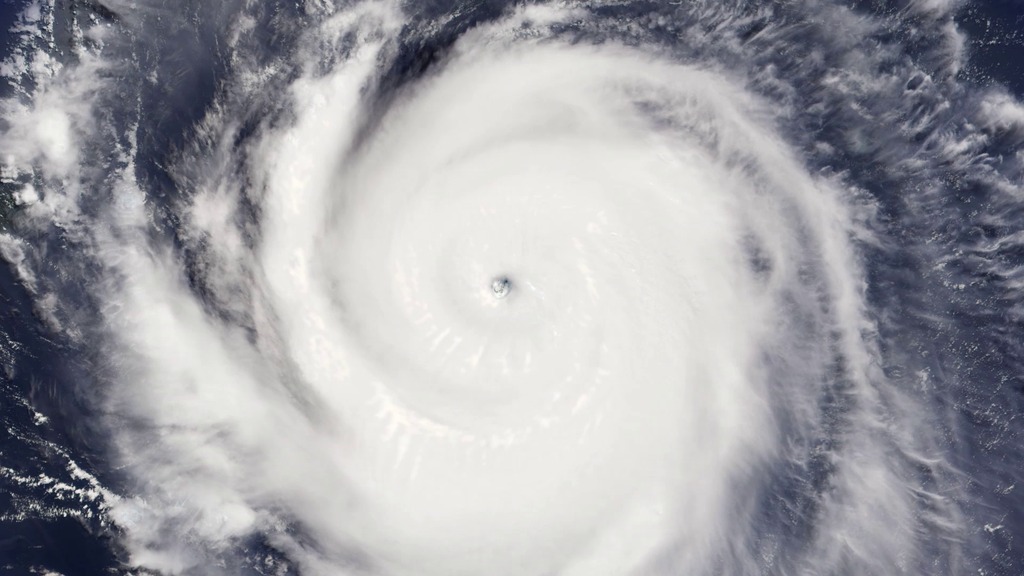
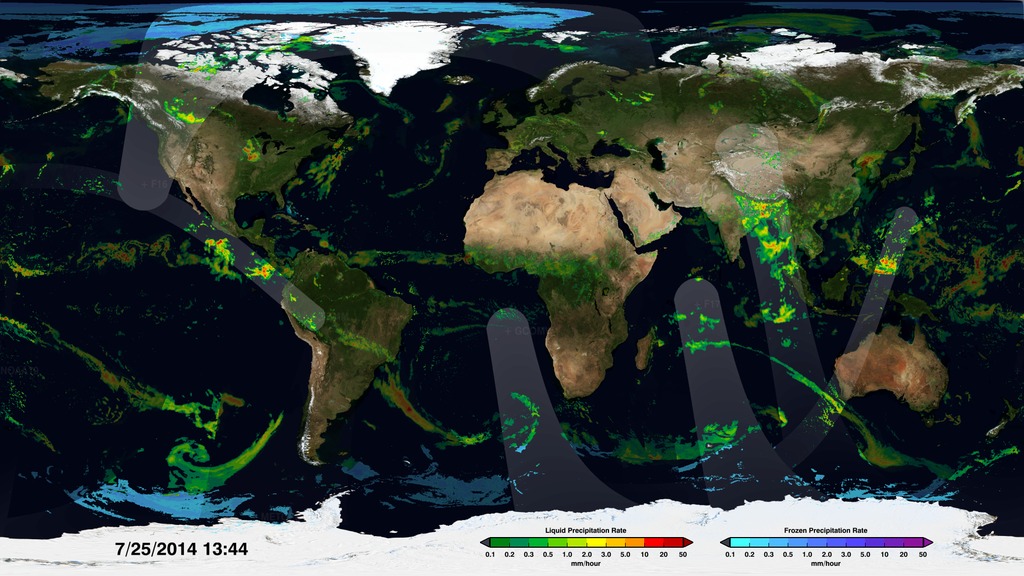
Not all raindrops are created equal. The size of falling raindrops depends on several factors, including where the cloud producing the drops is located on the globe and where the drops originate in the cloud. For the first time, scientists have three-dimensional snapshots of raindrops and snowflakes around the world from space, thanks to the joint NASA and Japan Aerospace Exploration Agency Global Precipitation Measurement (GPM) mission. With the new global data on raindrop and snowflake sizes this mission provides, scientists can improve rainfall estimates from satellite data and in numerical weather forecast models, helping us better understand and prepare for extreme weather events.
Watch this video on the NASA Goddard YouTube Channel.
Complete transcript available.
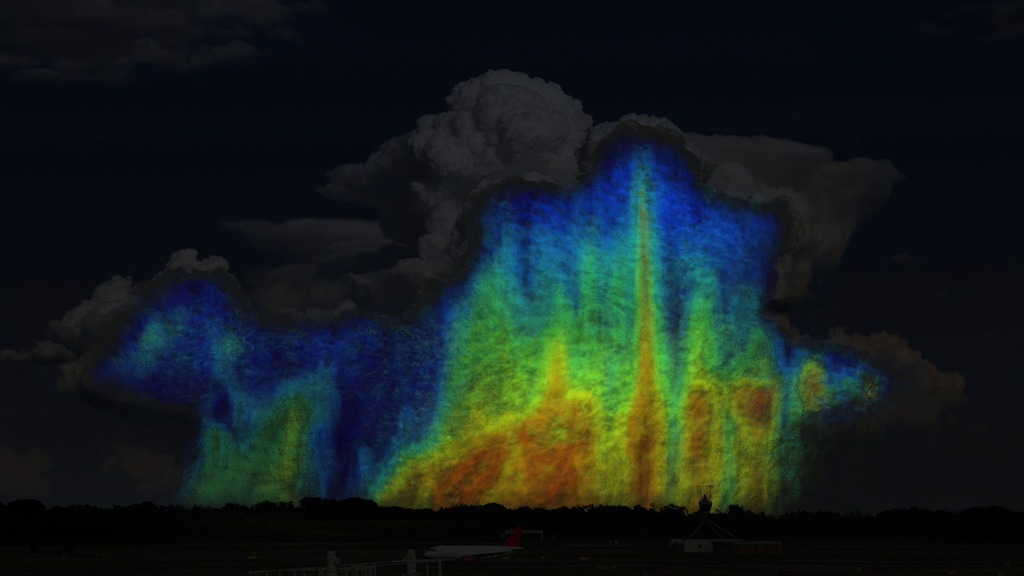
This is a conceptual animation showing how the size and distribution of raindrops varies within a storm.
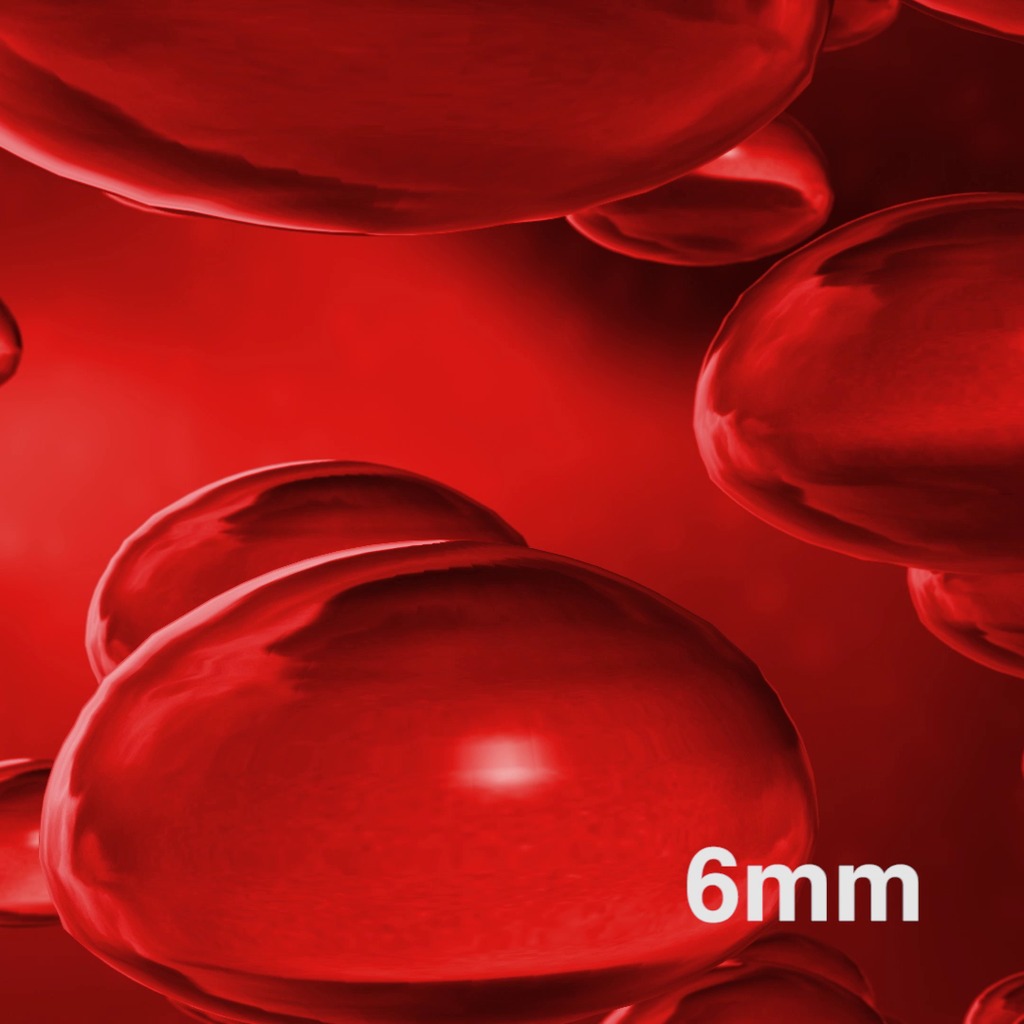
The animation travels from the top to the bottom of a storm. Blues and greens represent small raindrops that are 0.5-3mm in size. Yellows, oranges, and reds represent larger raindrops that are 4-6mm in size. A storm with a higher ratio of yellows, oranges, and reds will contain more water than a storm with a higher ratio of blues and greens.
Credit: NASA's Goddard Space Flight Center/Conceptual Image Lab

This is a high-resolution conceptual image showing the distribution of different sized raindrops within a storm. Blues and greens represent raindrops between 0.5-3 mm in size and yellows, oranges, and reds represent raindrops between 4-6mm in size.
Credit: NASA's Goddard Space Flight Center/Conceptual Image Lab

A GIF optimized for posting on Twitter.
This shows the distribution of different sized raindrops within a storm. Blues and greens represent raindrops between 0.5-3 mm in size and yellows, oranges, and reds represent raindrops between 4-6mm in size.

A GIF optimized for posting on Twitter.
Many small raindrops can be found near the top of a storm whereas bigger raindrops can be found in the middle and bottom. NASA's GPM satellite is measuring the size and distribution of raindrops globally.

A GIF optimized for posting on Twitter.
With GPM’s three-dimensional snapshots of drop size distribution, scientists can gain insight into the structure of a storm and how it will behave.

A GIF optimized for posting on Twitter.
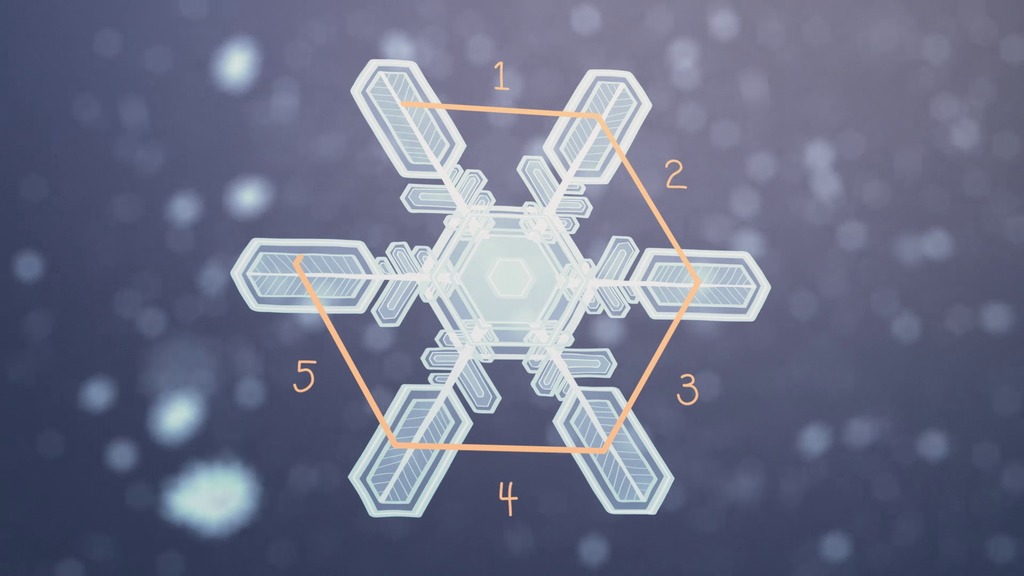
In the mid-latitudes, raindrops can originate from snowflakes, allowing them to melt into bigger raindrops compared to the tropics.
For More Information
See the following sources:
Credits
Please give credit for this item to:
NASA's Goddard Space Flight Center
Music credits: Dusk On The Plains by B. Boston, Life Cycles by Theo Golding
-
Scientists
- Gail Skofronick Jackson (NASA/GSFC)
-
George Huffman
(NASA/GSFC)

- Dalia B Kirschbaum (NASA/GSFC)
- Chris Kidd (University of Maryland)
-
Interviewee
- Stephen J. Munchak (University of Maryland)
-
Animators
- Michael Lentz (USRA)
- Krystofer Kim (USRA)
- Joy Ng (USRA)
-
Producers
- Joy Ng (USRA)
- Ryan Fitzgibbons (USRA)
-
Support
- Rani Gran (NASA/GSFC)
-
Writer
- Kasha Patel (NASA/GSFC)
Missions
This page is related to the following missions:Series
This page can be found in the following series:Related
- ID: 12507
 Produced Video
 - ID: 12206
 Produced Video
 - ID: 12261
- ID: 12185
 Produced Video
 - ID: 4369
 Visualization
 - ID: 11392
 Produced Video
Used as a Source In
- ID: 14617
 Produced Video
 - ID: 12197
 Produced Video
Release date
This page was originally published on Thursday, March 31, 2016.
This page was last updated on Sunday, December 15, 2024 at 11:24 PM EST.