A newer version of this visualization is available.
Global Landslide Catalog Aids View From Space
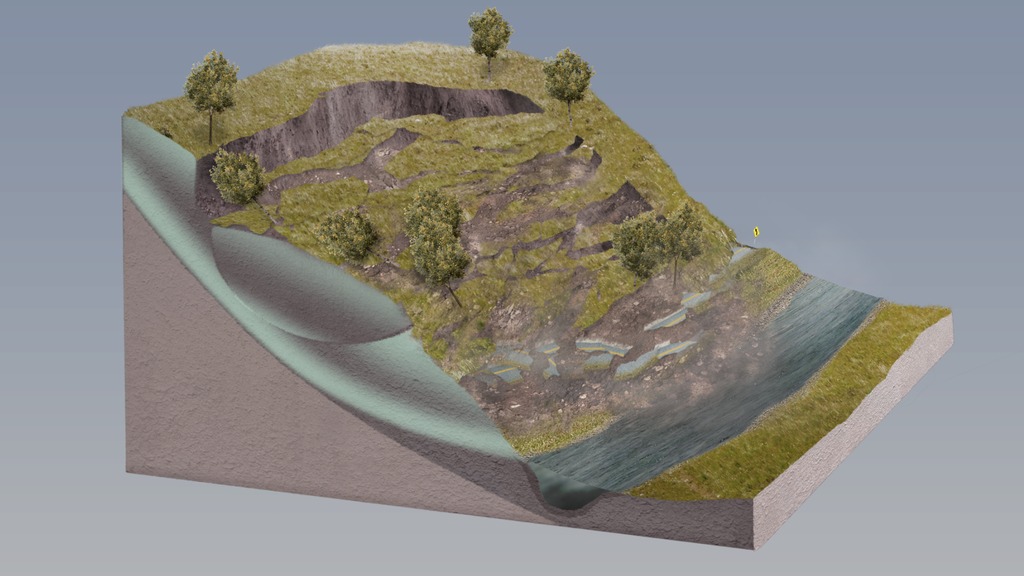
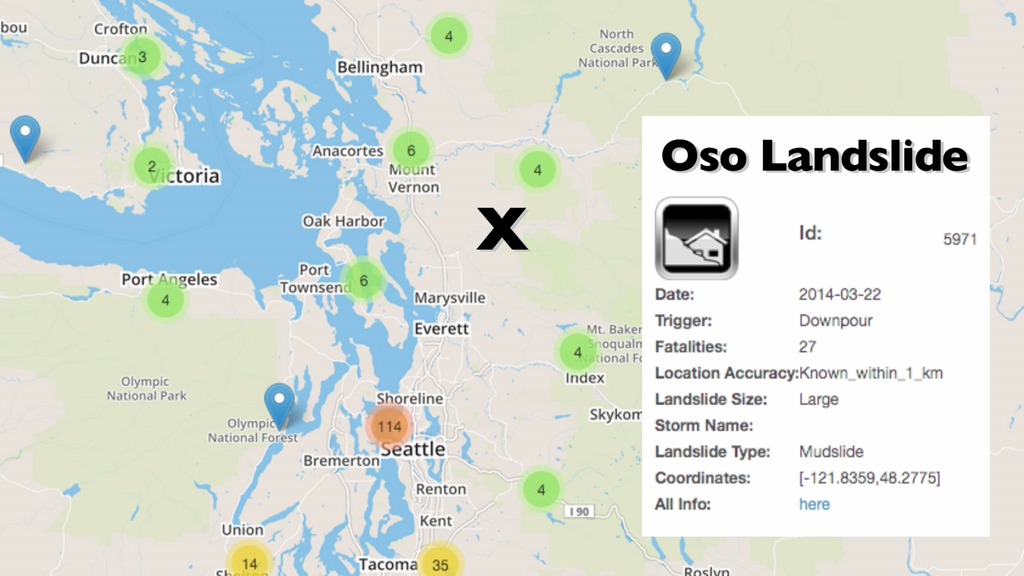
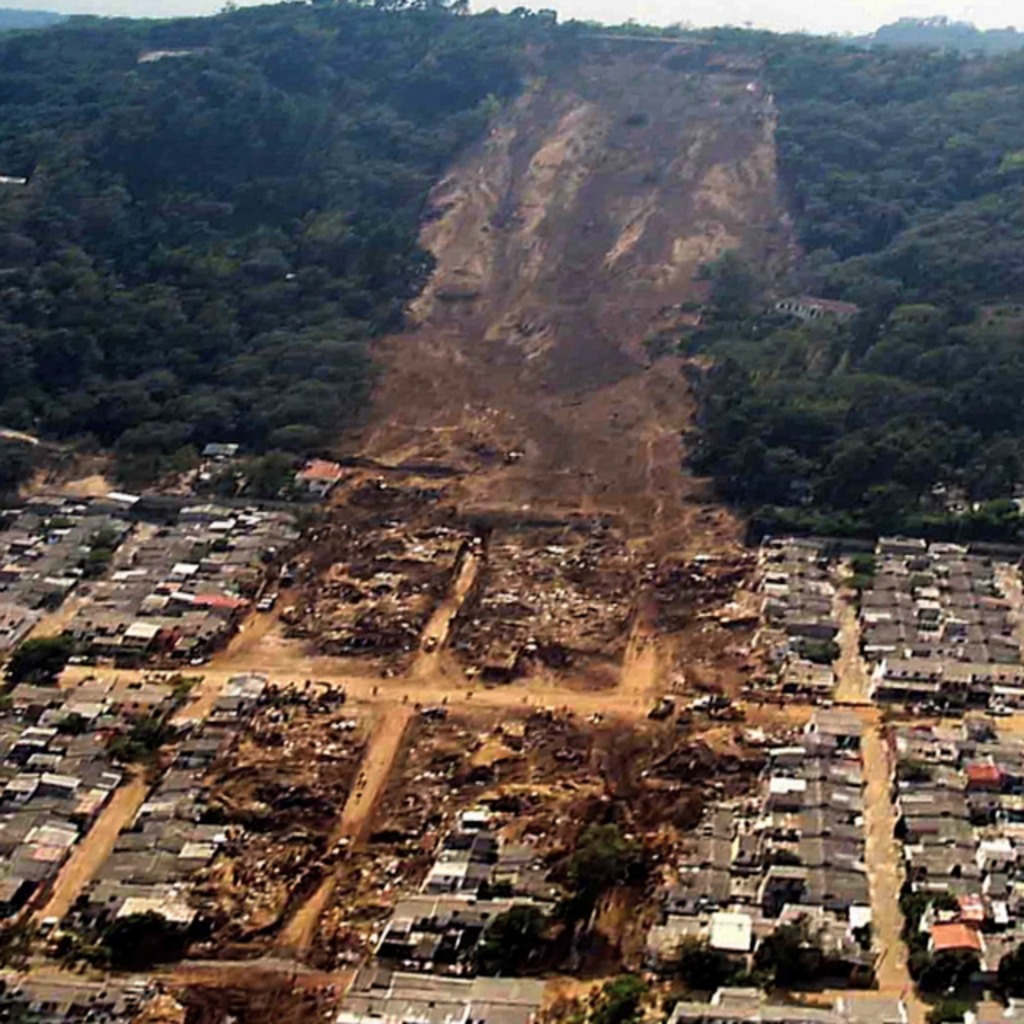
Landslides are among the most common and dramatic natural hazards, reshaping landscapes -- and anything in their path. Tracking when and where landslides occur worldwide has historically been difficult, because of the lack of a centralized database across all nations. But NASA researchers have updated the first publicly available Global Landslide Catalog, based on media reports and online databases that bring together many sources of information on landslides that have occurred since 2007. The catalog, originally released in 2010, is still the only one of its kind.
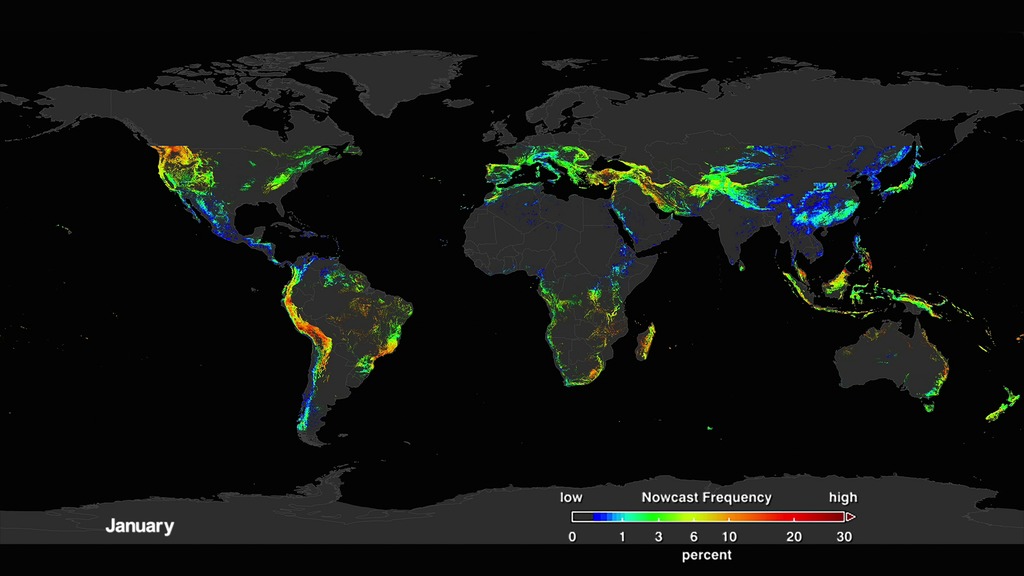
Around 6000 landslides are noted in the catalog. This wealth of data gives scientists a starting point to analyze where, how and why landslides are likely to occur. In particular, NASA researchers have begun to compare landslide occurrence with global rainfall data from the Tropical Rainfall Measuring Mission.
The catalog is currently available at: http://ojo-streamer.herokuapp.com/.
Research: Spatial and temporal analysis of a global landslide catalog.
Journal: Geomorphology, March 21, 2015.
Link to paper: http://www.sciencedirect.com/science/article/pii/S0169555X15001579.
Here is the YouTube video.
NASA scientists have updated the first publicly available catalog of global rainfall-triggered landslides. The catalog was originally released in 2010 and is still the only one of its kind.
For complete transcript, click here.

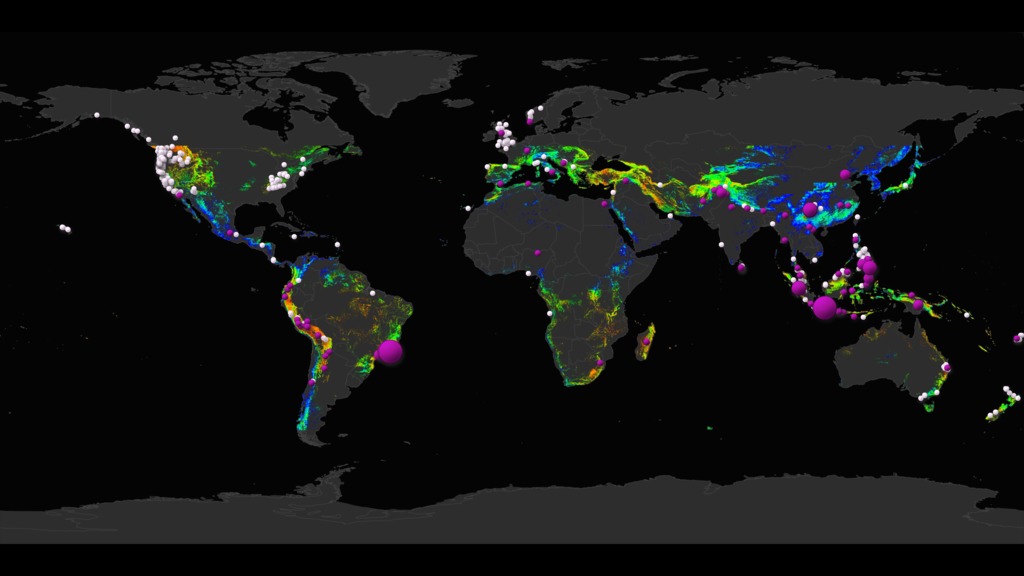
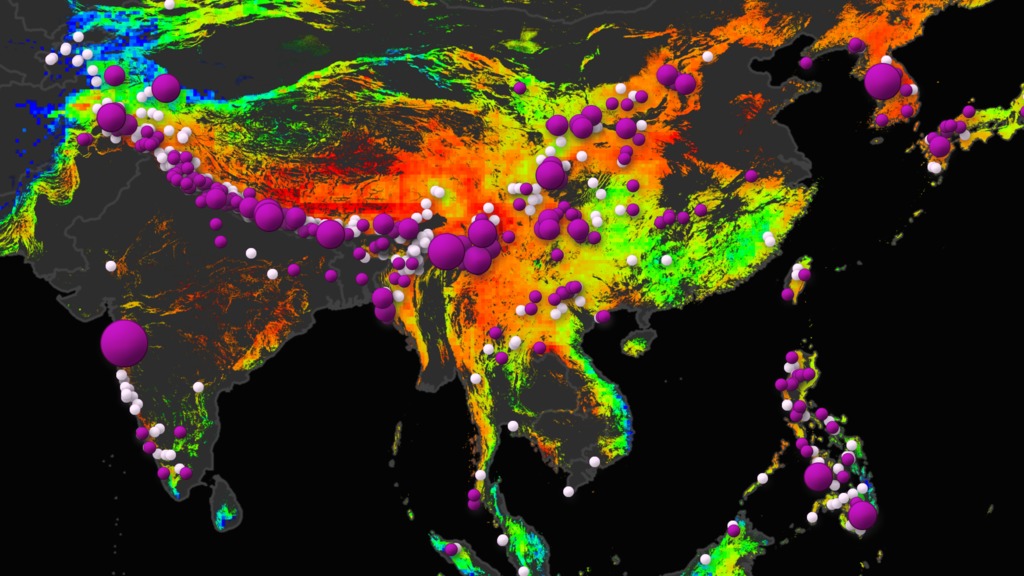
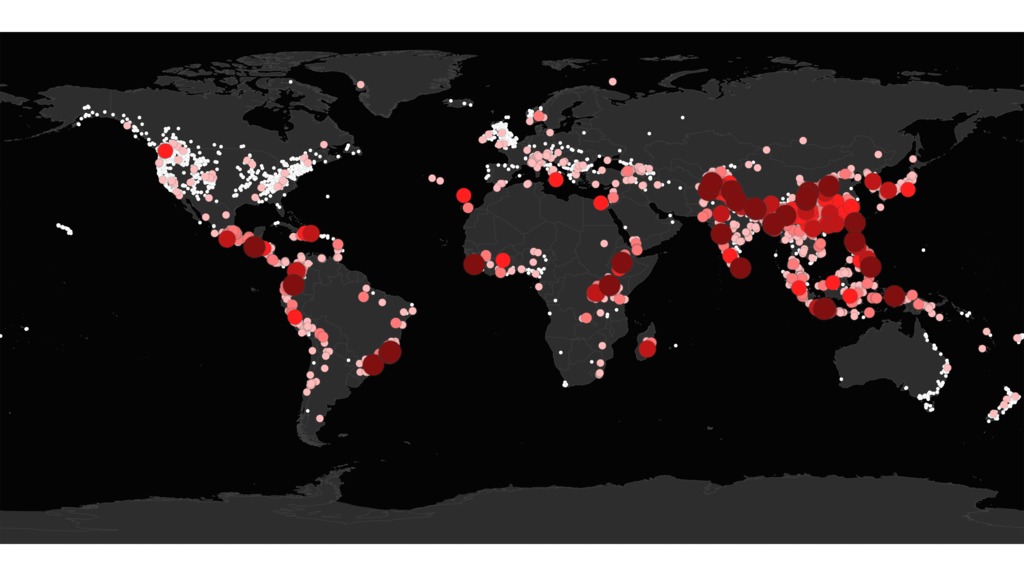
Using the Global Landslide Catalog, a map has been produced to show the location of 5741 rainfall-triggered landslides from 2007-2013.
Using the Global Landslide Catalog, a map has been produced to show the distribution and number of fatallities associated with 5741 rainfall-triggered landslides from 2007-2013.
Using the Global Landslide Catalog, a map, including a legend, has been produced to show the distribution and number of fatallities associated with 5741 rainfall-triggered landslides from 2007-2013.
This is a legend that accompanies the map that shows the distribution and number of fatallities associated with rainfall-triggered landslides in the Global Landslide Catalog.
For More Information
Credits
Please give credit for this item to:
NASA's Goddard Space Flight Center
-
Scientist
- Dalia B Kirschbaum (NASA/GSFC)
-
Producers
- Joy Ng (USRA)
- Kayvon Sharghi (USRA)
-
Narration
- Joy Ng (USRA)
-
Writer
- Ellen T. Gray (ADNET Systems, Inc.)
Missions
This page is related to the following missions:Series
This page can be found in the following series:Tapes
The media on this page originally appeared on the following tapes:-
First Landslide Catalog
(ID: 2015037)
Friday, April 10, 2015 at 4:00AM
Produced by - Liam Krauss (Hughes STX)
Related
- ID: 4631
- ID: 4640
- ID: 12897
- ID: 11926
 Produced Video
 - ID: 20226
 Animation
 - ID: 11860
- ID: 11855
 Produced Video
Newer Versions
- ID: 4632
 Visualization
Release date
This page was originally published on Thursday, April 16, 2015.
This page was last updated on Wednesday, May 3, 2023 at 1:49 PM EDT.