Close-up Views of the Global Landslide Hazard Assessment Model (LHASA) overlaid with Global Landslide Catalog (GLC) data
 global maps to allow for close-up views in any location around the world. The images showcase the landslide climatology by month overload with the distribution of reported landslide fatalities for the period 2007-2017.")
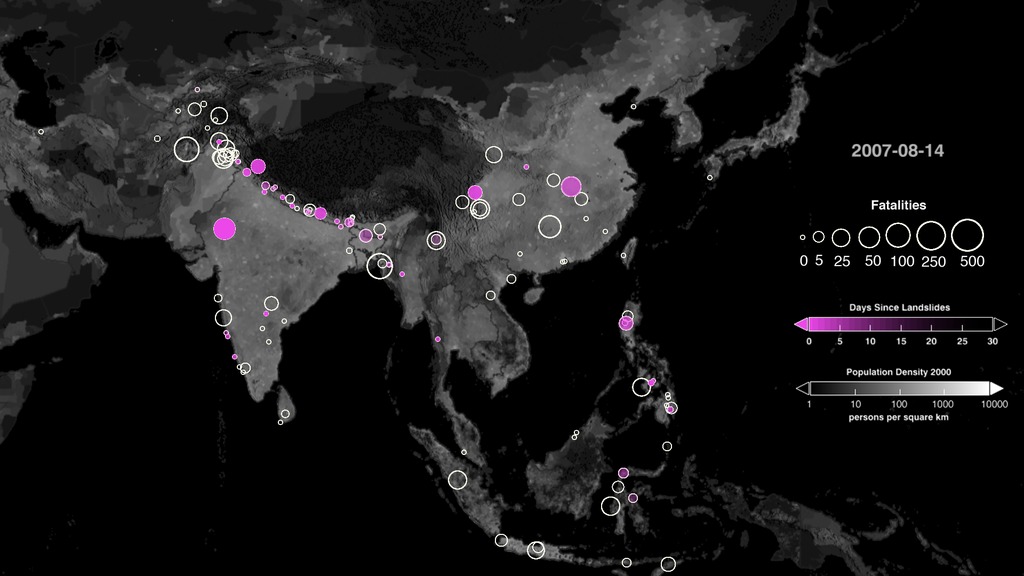
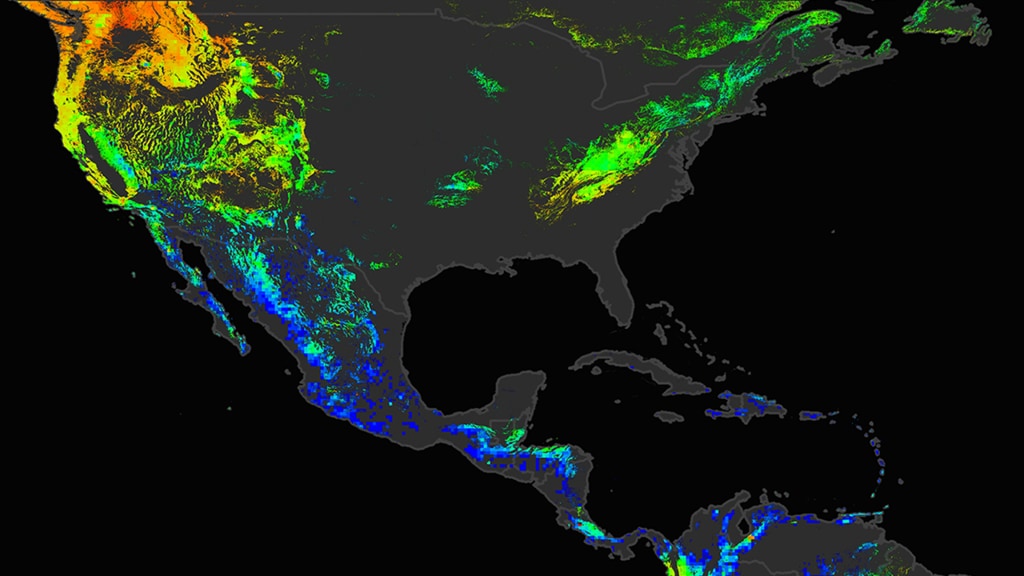
A close-up view of the potential landslide activity during July in Southeast Asia as evaluated by NASA's Landslide Hazard Assessment model for Situational Awareness.
In the Download tab to the right, a set of 12 still images provides high-resolution (9,600x5,400) global maps to allow for close-up views in any location around the world. The images showcase the landslide climatology by month overload with the distribution of reported landslide fatalities for the period 2007-2017.
This entry contains source material for the close-up views of: New NASA Model Finds Landslide Threats in Near Real-Time During Heavy Rains, released on March 22, 2018.
High resolution (of size 9,600x5,400) still images have been developed to enable close-up views in any location around the world. The material in this entry is provided by month and in separate layers.
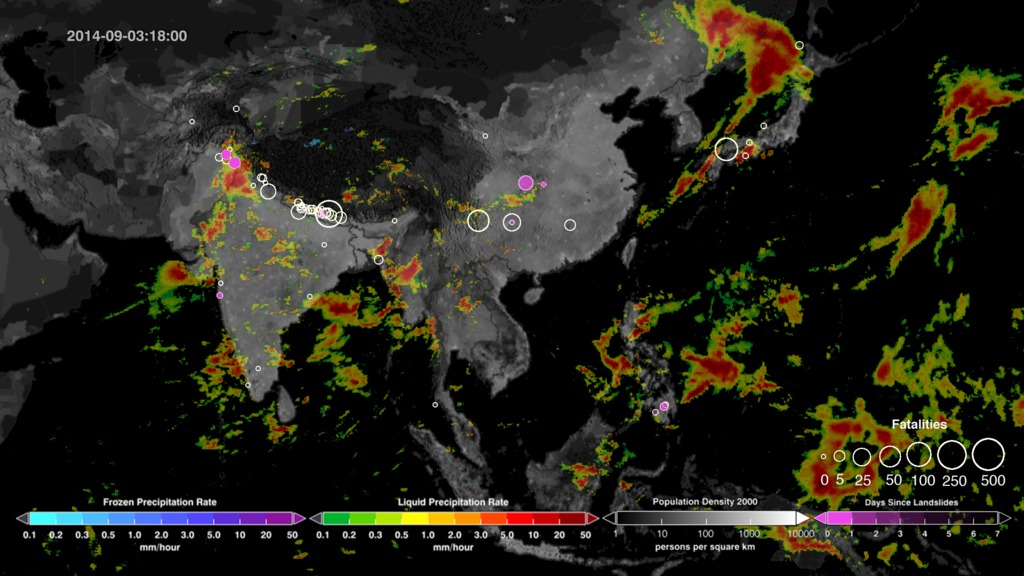
Landslides occur when an environmental trigger like an extreme rain event, often a severe storm or hurricane, and gravity's downward pull sets soil and rock in motion. Conditions beneath the surface are often unstable already, so the heavy rains act as the last straw that causes mud, rocks, or debris- or all combined- to move rapidly down mountains and hillsides. Unfortunately, people and property are often swept up in these unexpected mass movements. Landslides can also be caused by earthquakes, surface freezing and thawing, ice melt, the collapse of groundwater reservoirs, volcanic eruptions, and erosion at the base of a slope from the flow of river or ocean water. But torrential rains most commonly activate landslides.
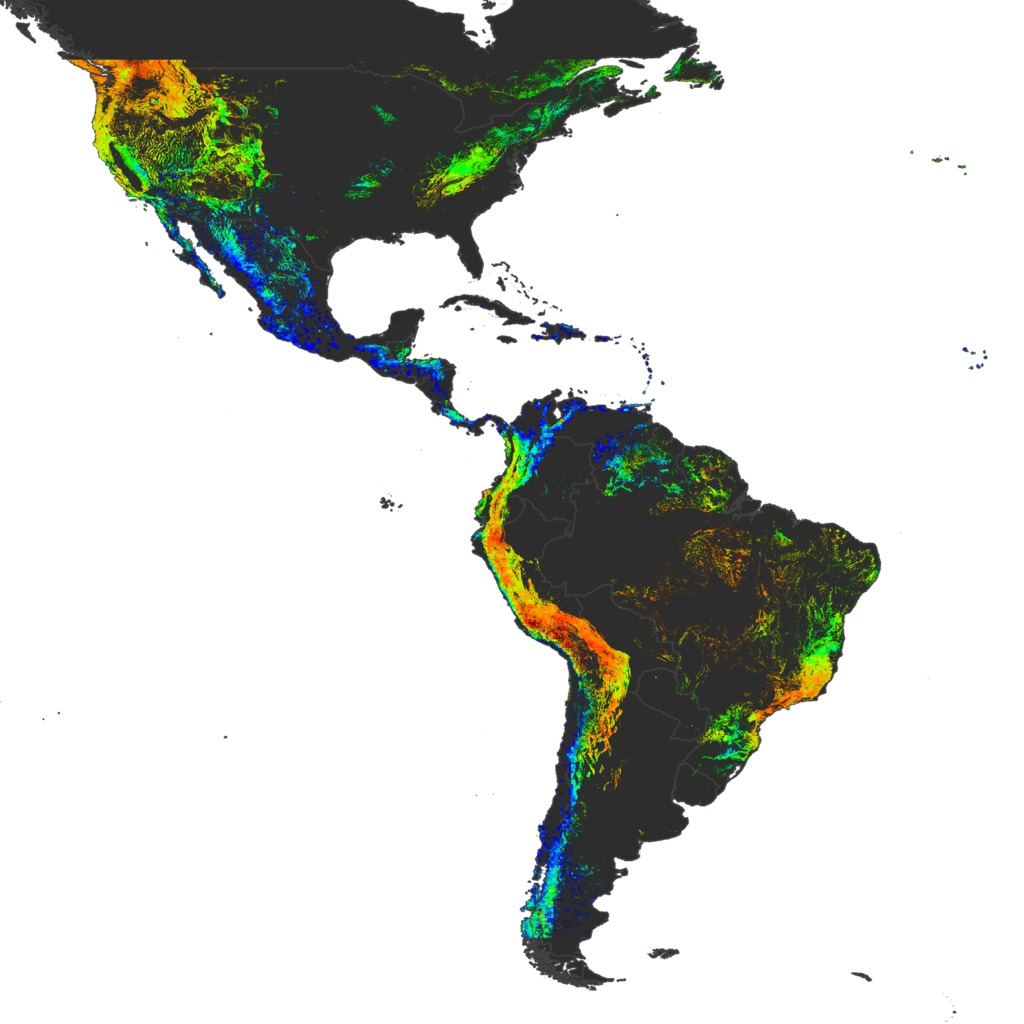
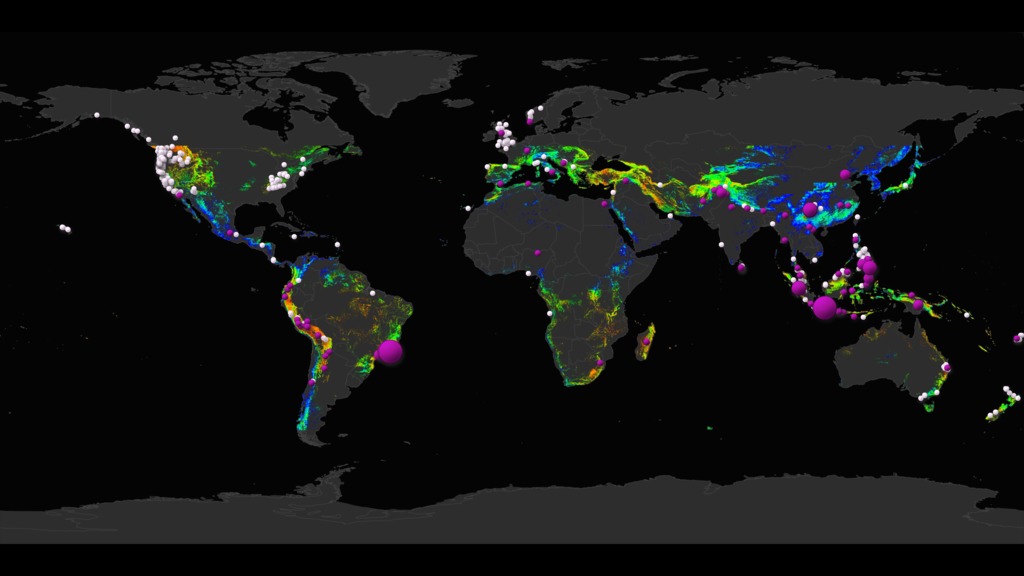
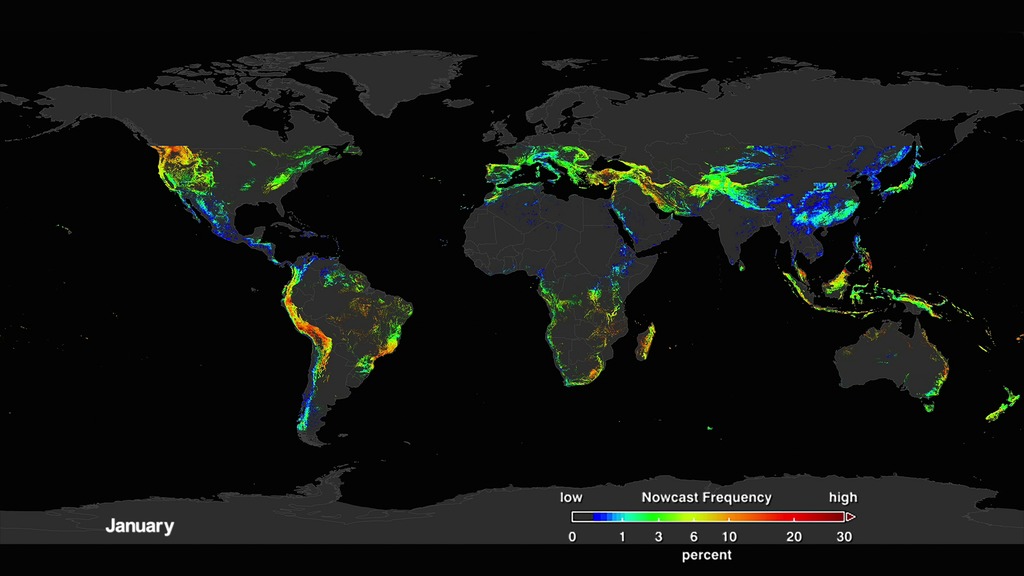
A new model has been developed to look at how potential landslide activity is changing around the world. A global Landslide Hazard Assessment model for Situational Awareness (LHASA) has been developed to provide an indication of where and when landslides may be likely around the world every 30min. This model uses surface susceptibility (including slope, vegetation, road networks, geology, and forest cover loss) and satellite rainfall data from the Global Precipitation Measurement (GPM) mission to provide moderate to high “nowcasts.” This visualization shows the landslide nowcast results leveraging nearly two decades of Tropical Rainfall Measurement Mission (TRMM) rainfall over 2001-2016 to identify a landslide climatology by month at a 1 km grid cell. The average nowcast values by month highlight the key landslide hotspots, such as the Southeast Asia during the monsoon season in June through August and the U.S. Pacific Northwest in December and January.
Overlaid with these nowcasts values are a Global Landslide Catalog (GLC) was developed with the goal of identifying rainfall-triggered landslide events around the world, regardless of size, impact, or location. The GLC considers all types of mass movements triggered by rainfall, which have been reported in the media, disaster databases, scientific reports, or other sources. The visualization shows the distribution of landslides each month based on the estimated number of fatalities the event caused. The GLC has been compiled since 2007 at NASA Goddard Space Flight Center and contains over 11,000 reports and growing. A new project called the Community the Cooperative Open Online Landslide Repository, or COOLR, provides the opportunity for the community to view landslide reports and contribute their own. The goal of the COOLR project is to create the largest global public online landslide catalog available and open to for anyone everyone to share, download, and analyze landslide information.
More information on this system is available at: https://landslides.nasa.gov
The Global Landslide Catalog is currently available here: https://catalog.data.gov/dataset/global-landslide-catalog-export

Colorbar for the landslide climatology.
Legend for the reported landslide fatalities. This legend should accompany the visuals of size 9,600x5,400 and should be scaled accordingly to reflect the appropriate size of the dots.

This set of 12 still images serves as the months layer.
 to allow for close-up views in any location around the world.")
This set of 12 still images show the potential landslide activity by month averaged over the last 15 years as evaluated by NASA's Landslide Hazard Assessment model for Situational Awareness. The still images are global maps and are provided in high-resolution (9,600x5,400) to allow for close-up views in any location around the world.
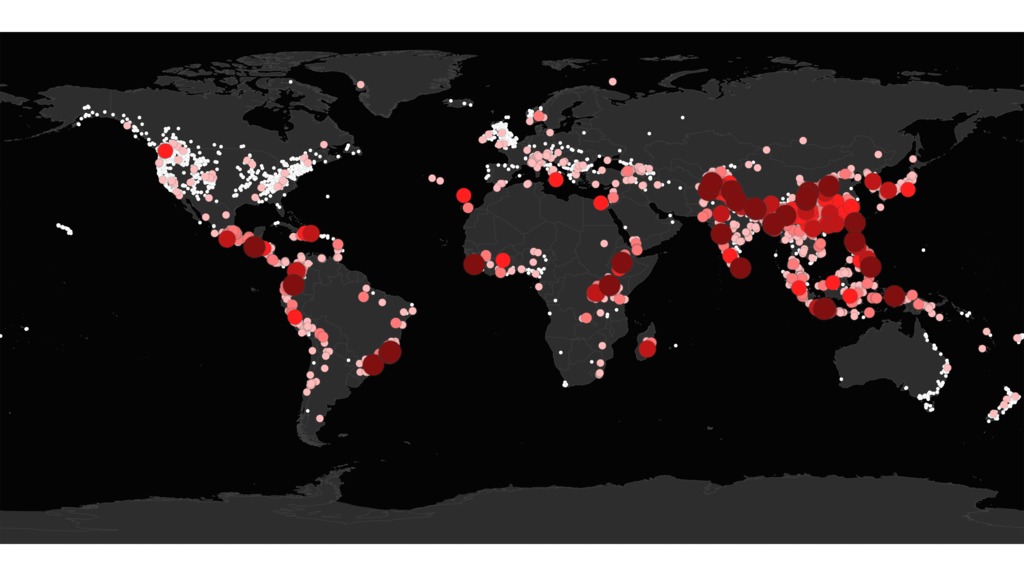
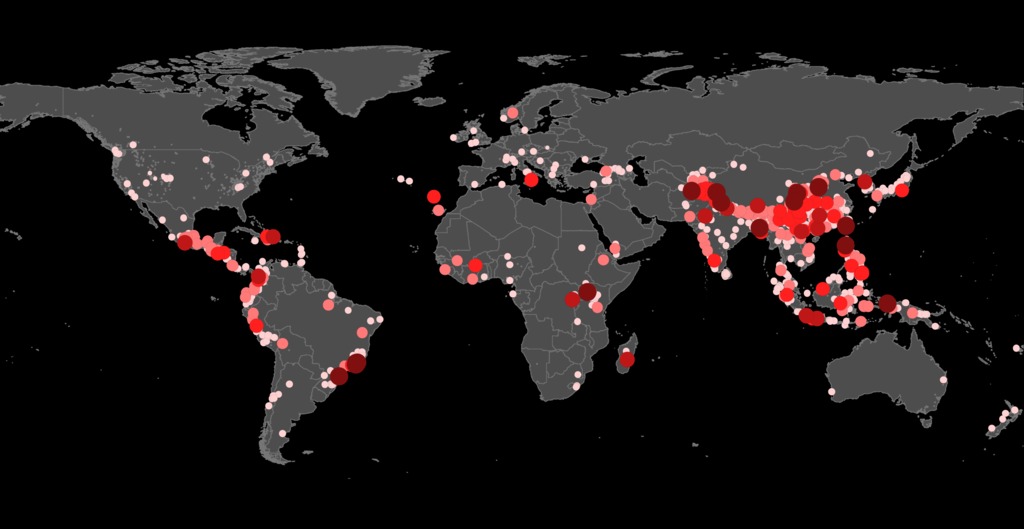
Using the Global Landslide Catalog, a map, including a legend, has been produced to show the distribution and number of reported fatallities associated with approximately 10,804 rainfall-triggered landslides from 2007-2017. Out of the 10,804 reported rainfall-triggered landslides, 8,369 incidents had zero fatalities. White dots represent incidents with zero reported fatalities. Purple dots (small to large) represent incidents with fatalities in the range of 1-5000. This map is provided in 9600x5400 to allow for close-up views in any location around the world or to be previewed on hyperwall.
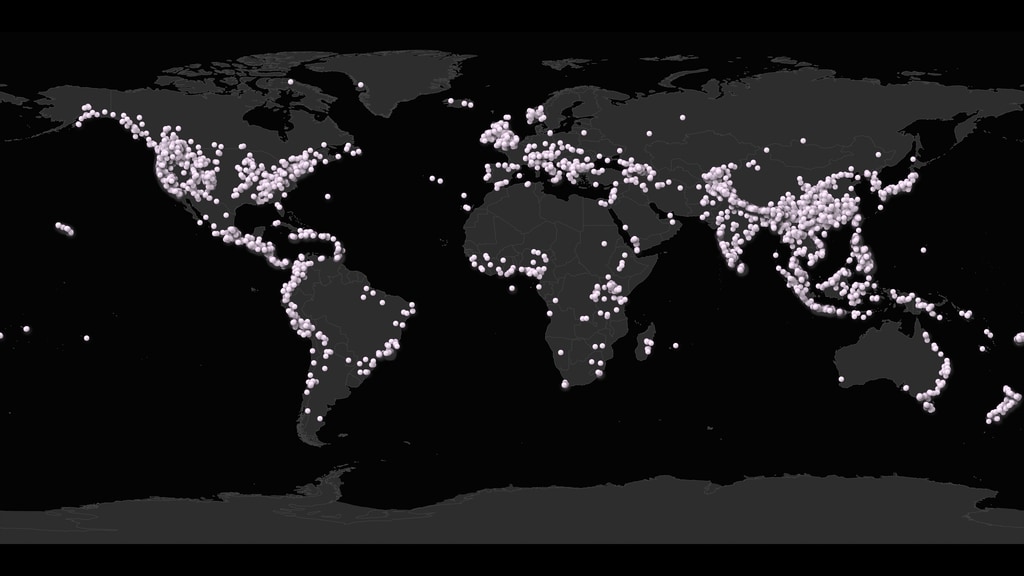
Using the Global Landslide Catalog, a map has been produced to show the location of 8,369 zero reported fatalities associated with rainfall-triggered landslides for the period 2007-2017.This map is provided in 9600x5400 to allow for close-up views in any location around the world or to be previewed on hyperwall.
Using the Global Landslide Catalog, a map, has been produced to show the distribution and number of reported fatallities associated with approximately 10,804 rainfall-triggered landslides from 2007-2017. Out of the 10,804 reported rainfall-triggered landslides, 8,369 incidents had zero fatalities. White dots represent incidents with zero reported fatalities. Purple dots (small to large) represent incidents with fatalities in the range of 1-5000. This map is provided in 9600x5400 to allow for close-up views in any location around the world or to be previewed on hyperwall.
This is a legend that accompanies the map that shows the distribution and number of fatallities associated with rainfall-triggered landslides in the Global Landslide Catalog for 2007-2017. This legend should accompany the map of size 9600x5400.
For More Information
See the following sources:
Credits
Please give credit for this item to:
NASA's Scientific Visualization Studio
-
Visualizers
-
Helen-Nicole Kostis
(USRA)

- Horace Mitchell (NASA/GSFC)
-
Greg Shirah
(NASA/GSFC)
-
Helen-Nicole Kostis
(USRA)
-
Scientists
- Dalia B Kirschbaum (NASA/GSFC)
- Thomas A. Stanley (USRA)
-
Producers
- Ryan Fitzgibbons (USRA)
- Joy Ng (USRA)
-
Technical support
- Ian Jones (ADNET Systems, Inc.)
- Laurence Schuler (ADNET Systems, Inc.)
-
Project support
- Joycelyn Thomson Jones (NASA/GSFC)
- Leann Johnson (Global Science and Technology, Inc.)
- Eric Sokolowsky (Global Science and Technology, Inc.)
Missions
This page is related to the following missions:Related papers
Dalia Kirschbaum and Thomas Stanley, Satellite-Based Assessment of Rainfall-Triggered Landslide Hazard for Situational Awareness, Earth's Future, Volume 6, Issue 3, March 2018, Pages 297-616, ISSN 2328-4277, doi.org/10.1002/2017EF000715
Dalia Kirschbaum and Thomas Stanley, Satellite-Based Assessment of Rainfall-Triggered Landslide Hazard for Situational Awareness, Earth's Future, Volume 6, Issue 3, March 2018, Pages 297-616, ISSN 2328-4277, doi.org/10.1002/2017EF000715
Datasets used
-
GLC (Global Landslide Catalogue)
ID: 872 -
Global Landslide Model (Global Landslide Hazard Assessment for Situational Awareness (LHASA))
ID: 1001https://pmm.nasa.gov/applications/global-landslide-modelThe global Landslide Hazard Assessment for Situational Awareness (LHASA) model is developed to provide situational awareness of landslide hazards for a wide range of users. Precipitation is
See all pages that use this dataset
Note: While we identify the data sets used on this page, we do not store any further details, nor the data sets themselves on our site.
Related
- ID: 4710
 Visualization
 - ID: 4632
 Visualization
 - ID: 4633
- ID: 4305
- ID: 4304
- ID: 11854
 Produced Video
Alternate Versions
- ID: 4631
Used as a Source In
- ID: 13126
 Produced Video
 - ID: 12897
Release date
This page was originally published on Wednesday, April 25, 2018.
This page was last updated on Sunday, February 2, 2025 at 12:10 AM EST.