NASA On Air: NASA Tracks Hurricane Wind Fields (3/3/2015)
LEAD: NASA is helping us visualize how winds affect hurricane paths by assimilating satellite data with observations from ships and buoys.
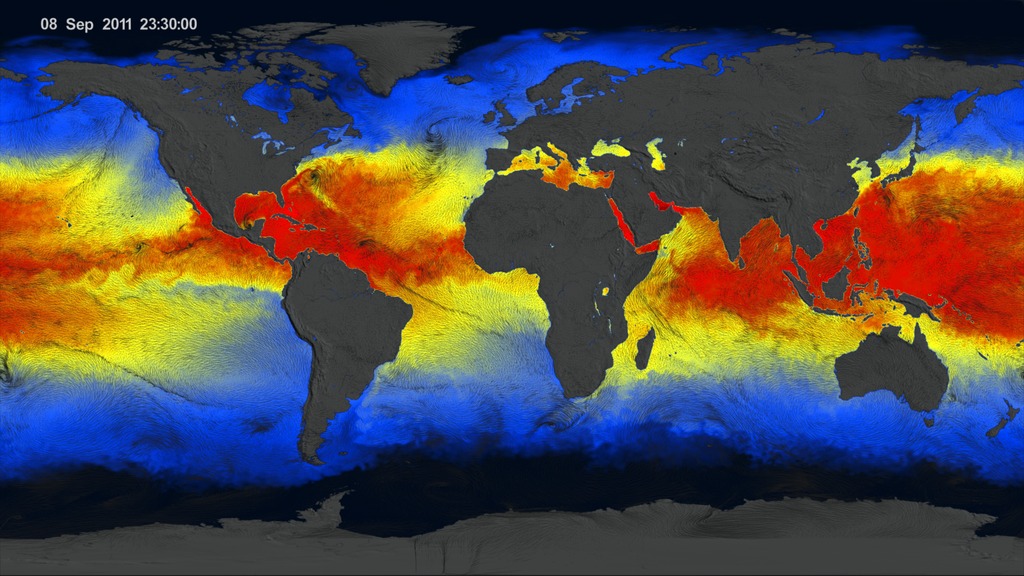
1. In this view of the Atlantic Ocean, the reds and yellows indicate warm ocean water.
2. In September 2011, Hurricane Ophelia was pushed by ocean winds right up the alley between a high and a low.
3. Just three days later, the winds changed and Hurricane Philippe was steered towards the U.S. Would Philippe threaten the East Coast?
4. No. Strong winds from the north, a cold front, caused Hurricane Philippe to take a 180-degree turn and move safely away from the U.S.
TAG: Combing satellite data with ship and buoy observations and models will help forecasters make better predictions of hurricane tracks.
For More Information
See the following sources:
Credits
Please give credit for this item to:
NASA's Goddard Space Flight Center
-
Producer
- Howard Joe Witte (ADNET Systems, Inc.)
-
Data visualizers
-
Greg Shirah
(NASA/GSFC)

- Horace Mitchell (NASA/GSFC)
- Lori Perkins (NASA/GSFC)
-
Greg Shirah
(NASA/GSFC)
-
Video editor
- Joy Ng (USRA)
Missions
This page is related to the following missions:Datasets used
-
CCMP (Cross-Calibrated Multi-Platform Ocean Surface Wind Vector Analyses)
ID: 844 -
MUR SST (Multi-scale Ultra-high Resolution (MUR) Sea Surface Temperature (SST) Analysis)
ID: 845
Note: While we identify the data sets used on this page, we do not store any further details, nor the data sets themselves on our site.
Related
- ID: 4240
 Visualization
Release date
This page was originally published on Tuesday, March 3, 2015.
This page was last updated on Wednesday, May 3, 2023 at 1:49 PM EDT.