GPM Core Spacecraft Beauty Passes
A variety of animated beauty passes of the Global Precipitation Measurement (GPM) Core spacecraft.
Various beauty passes of the GPM Core spacecraft.
The GPM Core satellite cruises over a hurricane.
Credits
Please give credit for this item to:
NASA's Goddard Space Flight Center
-
Animators
- Walt Feimer (HTSI)
- Chris Meaney (HTSI)
-
Producers
- Ryan Fitzgibbons (USRA)
- Brooke Harris (USRA)
Missions
This page is related to the following missions:Related
- ID: 12592
 Produced Video
 - ID: 12185
 Produced Video
 - ID: 12182
 Produced Video
 - ID: 12091
 Produced Video
 - ID: 12053
- ID: 12050
 Produced Video
 - ID: 4369
 Visualization
Used as a Source In
- ID: 14617
 Produced Video
 - ID: 13348
![Complete transcript available.Music Credits: "Battle For Our Future" and "Wonderful Orbit" by Tom Furse Fairfax Cowan [PRS], "Transitions" by Ben Niblett [PRS] and Jon Cotton [PRS], "Emerging Discovery by "Rik Carter [PRS] from Killer Tracks](/vis/a010000/a013300/a013348/13348_DailyCycleOfRain_YouTube.00561_print.jpg) Produced Video
Produced Video - ID: 13216
![Complete transcript available.Music credits: “Northern Breeze” by Denis Levaillant [SACEM], “Stunning Horizon” by Maxime Lebidois [SACEM], Ronan Maillard [SACEM], “Magnetic Force” by JC Lemay [SACEM] from Killer TracksWatch this video on the NASA Goddard YouTube channel.This video can be freely shared and downloaded. While the video in its entirety can be shared without permission, some individual imagery provided by pond5.com is obtained through permission and may not be excised or remixed in other products. Specific details on stock footage may be found here. For more information on NASA’s media guidelines, visit https://www.nasa.gov/multimedia/guidelines/index.html.Notes on footage:• 0:03 - 0:17 provided by Pond5• 1:38 - 1.43 provided by Pond5• 1:49 - 1:52 provided by Pond5• 2:21 - 1:27 provided by Pond5](/vis/a010000/a013200/a013216/13216_NASA_Has_Eyes_On_The_Atlantic_Hurricane_Season_YouTube.00050_print.jpg) Produced Video
Produced Video - ID: 12848
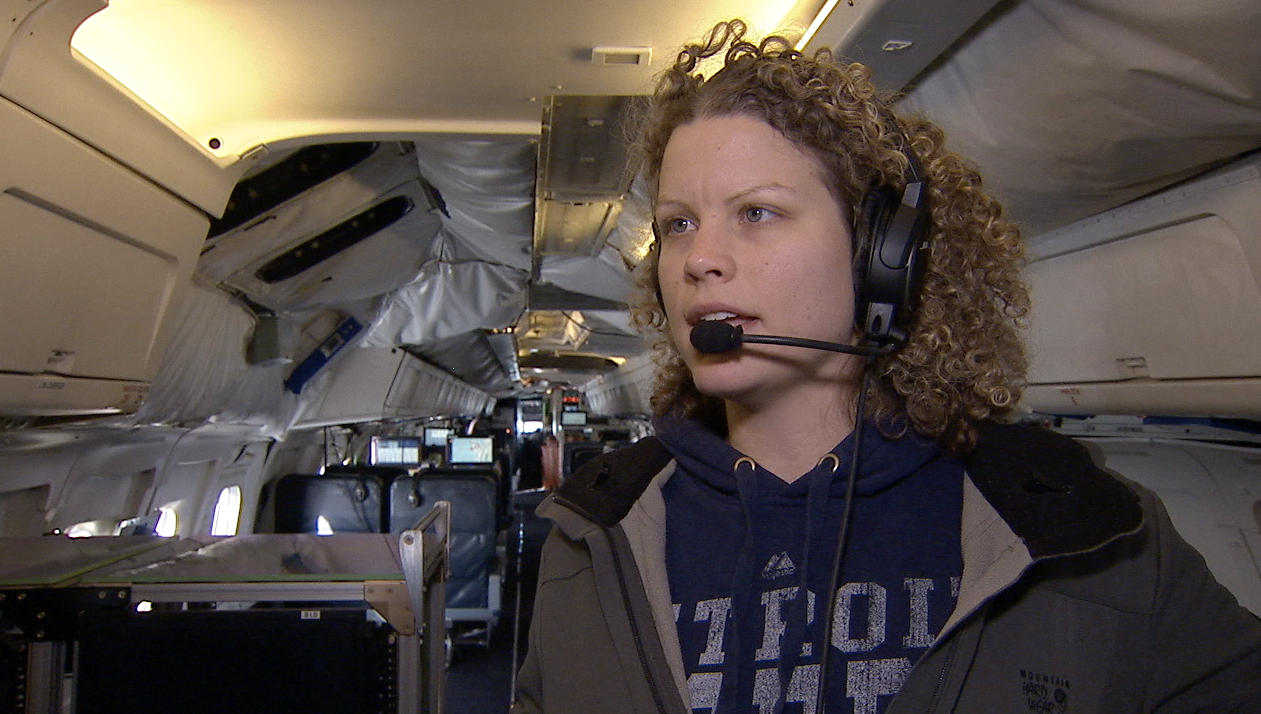
![Complete transcript available.Music credit: “Reach Into The Night” by Andrew Michael Britton [PRS], David Stephen Goldsmith [PRS], Mikey Rowe [PRS] and “Progressive Practice” by Emmanuel David Lipszyc [SACEM], Franck Lascombes [SACEM], Sebastien Charles Lipszyc [SACEM] From Killer TracksWatch this video on the NASA Goddard YouTube channel.](/vis/a010000/a012800/a012848/12848_ICEPOP_Final.00547_print.jpg) Produced Video
Produced Video - ID: 12738
![Watch this video on the NASA Goddard YouTube channel.Complete transcript available.Music credits: 'Micro Currents' by Jean-Patrick Voindrot [SACEM], 'Sink Deep' by Andrew Michael Britton [PRS], David Stephen Goldsmith [PRS], Mikey Rowe [PRS] from Killer Tracks.](/vis/a010000/a012700/a012738/LARGE_MP4-12738_RapidIntensification_large.00084_print.jpg) Produced Video
Produced Video
Release date
This page was originally published on Thursday, October 31, 2013.
This page was last updated on Wednesday, May 3, 2023 at 1:51 PM EDT.