Three Years of SDO Images
In the three years since it first provided images of the sun in the spring of 2010, NASA's Solar Dynamics Observatory (SDO) has had virtually unbroken coverage of the sun's rise toward solar maximum, the peak of solar activity in its regular 11-year cycle. This video shows those three years of the sun at a pace of two images per day. Each image is displayed for two frames at a 29.97 frame rate.
SDO's Atmospheric Imaging Assembly (AIA) captures a shot of the sun every 12 seconds in 10 different wavelengths. The images shown here are based on a wavelength of 171 angstroms, which is in the extreme ultraviolet range and shows solar material at around 600,000 Kelvin. In this wavelength it is easy to see the sun's 25-day rotation as well as how solar activity has increased over three years.
During the course of the video, the sun subtly increases and decreases in apparent size. This is because the distance between the SDO spacecraft and the sun varies over time. The image is, however, remarkably consistent and stable despite the fact that SDO orbits the Earth at 6,876 miles per hour and the Earth orbits the sun at 67,062 miles per hour.
Such stability is crucial for scientists, who use SDO to learn more about our closest star. These images have regularly caught solar flares and coronal mass ejections in the act, types of space weather that can send radiation and solar material toward Earth and interfere with satellites in space. SDO's glimpses into the violent dance on the sun help scientists understand what causes these giant explosions — with the hopes of some day improving our ability to predict this space weather.
The four wavelength view at the end of the video shows light at 4500 angstroms, which is basically the visible light view of the sun, and reveals sunspots; light at 193 angstroms which highlights material at 1 million Kelvin and reveals more of the sun's corona; light at 304 angstroms which highlights material at around 50,000 Kelvin and shows features in the transition region and chromosphere of the sun; and light at 171 angstroms.
Noteworthy events that appear briefly in the main sequence of this video:
00:30;24 Partial eclipse by the moon
00:31;16 Roll maneuver
01:11;02 August 9, 2011 X6.9 Flare, currently the largest of this solar cycle
01:28;07 Comet Lovejoy, December 15, 2011
01:42;29 Roll Maneuver
01:51;07 Transit of Venus, June 5, 2012
02:28;13 Partial eclipse by the moon
Watch this video on YouTube.
Video of three years-worth of SDO data at a wavelength of 171 angstroms and then 4 different synchronized wavelengths: 171, 304, 193, and 4500. Information about the still image is below.
Music: "A Lady's Errand of Love" - composed and performed by Martin Lass
For complete transcript, click here.
This version of SDO:Three Years in Three Minutes is extended and narrated by NASA's Goddard Space Flight Center heliophysicist Alex Young. He highlights many interesting aspects of the video and points out several of the single-frame events that appear in it.
For complete transcript, click here.

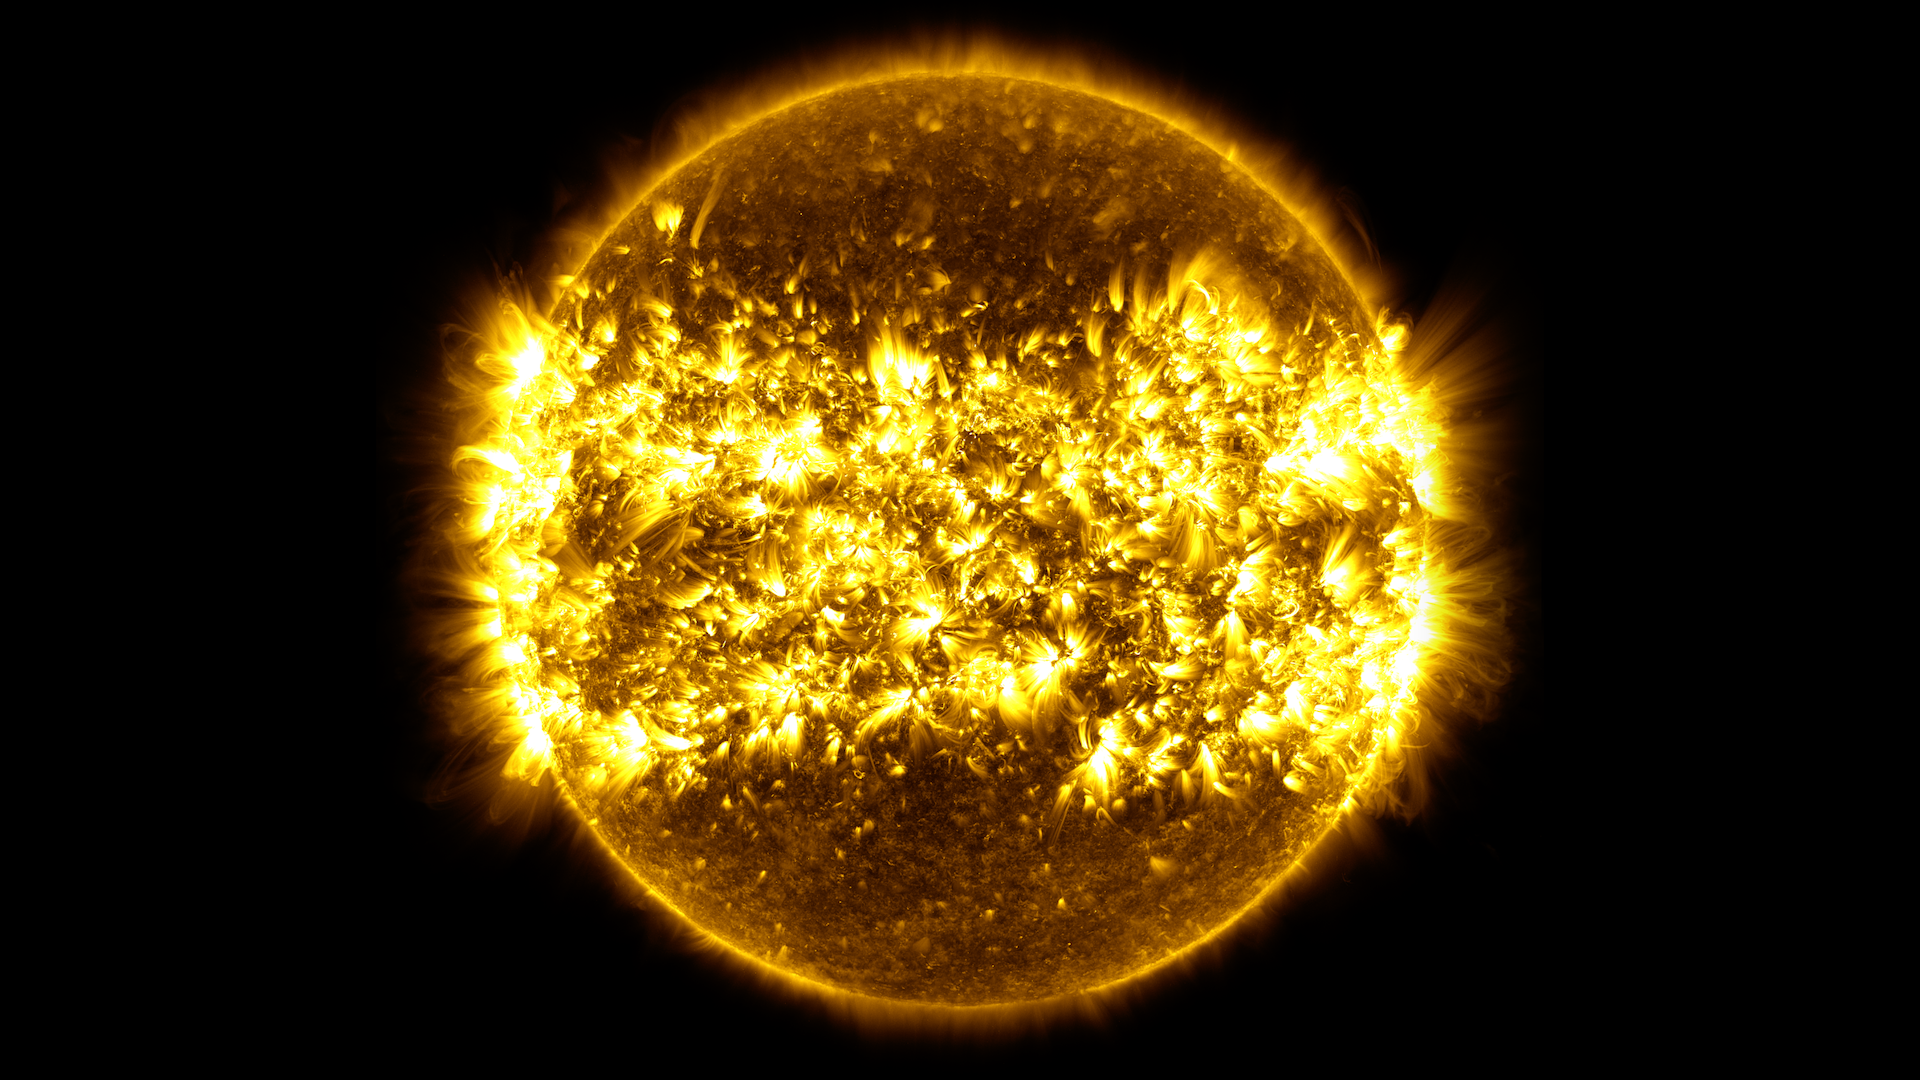
This image, and the one at the top, is a composite of 25 separate images spanning the period of April 16, 2012 to April 15, 2013. It uses the SDO AIA wavelength of 171 angstroms and reveals the zones on the sun where active regions are most common during this part of the solar cycle. This version is widened to achieve a 16x9 aspect ratio.
Credit: NASA's Goddard Space Flight Center/SDO/S. Wiessinger
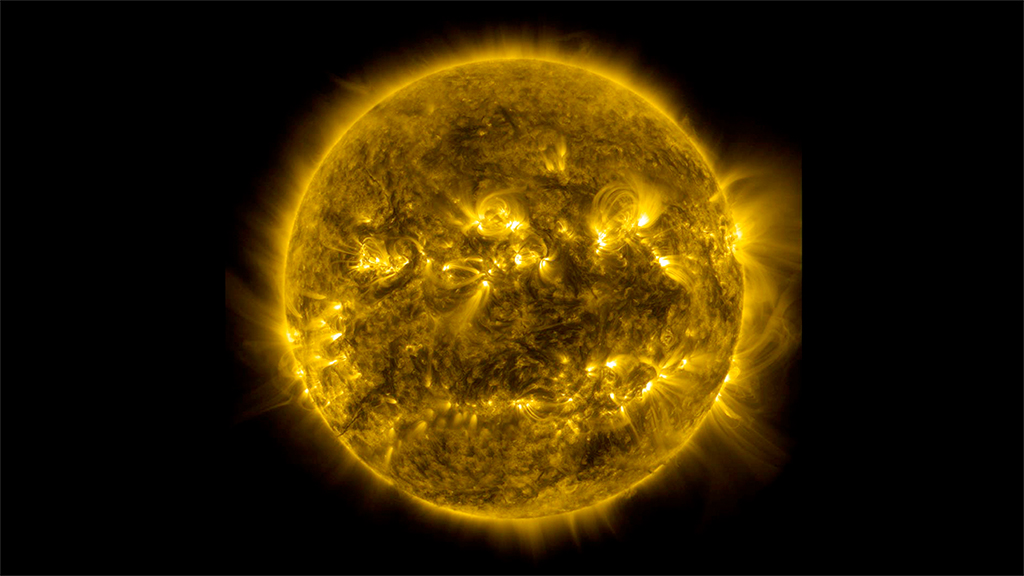
This image, is a composite of 25 separate images spanning the period of April 16, 2012 to April 15, 2013. It uses the SDO AIA wavelength of 171 angstroms and reveals the zones on the sun where active regions are most common during this part of the solar cycle. This version maintains the original aspect ratio of the AIA instrument imagery.
Credit: NASA's Goddard Space Flight Center/SDO/S. Wiessinger
This video shows the sun in the 171 angstrom wavelength of extreme ultraviolet light. It covers a time period of June 2, 2010 to April 15, 2013 at a cadence of two frames per day, or one frame every 12 hours. Early in the sequence, SDO's coverage was intermittent, so not every day is represented. 171 angstrom light highlights material around 600,000 Kelvin and shows features in the upper transition region and quiet corona of the sun. The still image shows a partial eclipse of the sun by the moon from SDO's perspective.
This video shows the sun in the 304 angstrom wavelength of extreme ultraviolet light. It covers a time period of June 2, 2010 to April 15, 2013 at a cadence of one frame per day. Early in the sequence, SDO's coverage was intermittent, so not every day is represented. 304 angstrom light highlights material around 50,000 Kelvin and shows features in the transition region and chromosphere of the sun. The still shows a large prominence from Sept 15, 2010.
This video shows the sun in the 171 angstrom wavelength of extreme ultraviolet light. It covers a time period of June 2, 2010 to April 15, 2013 at a cadence of one frame per day. Early in the sequence, SDO's coverage was intermittent, so not every day is represented. 171 angstrom light highlights material around 600,000 Kelvin and shows features in the upper transition region and quiet corona of the sun.
This video shows the sun in the 4500 angstrom wavelength of light. It covers a time period of June 2, 2010 to April 15, 2013 at a cadence of one frame per day. Early in the sequence, SDO's coverage was intermittent, so not every day is represented. 4500 angstrom light highlights material around 6,000 Kelvin and matches the visible light appearance of the sun. The layer of the sun visible in this wavelength is called the photosphere.
This video shows the sun in the 193 angstrom wavelength of extreme ultraviolet light. It covers a time period of June 2, 2010 to April 15, 2013 at a cadence of one frame per day. Early in the sequence, SDO's coverage was intermittent, so not every day is represented. 193 angstrom light highlights material around 1 million Kelvin and shows features in the corona and flare plasma. 193 also reveals dark areas called coronal holes where the high-speed solar wind originates.
For More Information
Credits
Please give credit for this item to:
NASA's Goddard Space Flight Center/SDO
-
Video editor
- Scott Wiessinger (USRA)
-
Producer
- Scott Wiessinger (USRA)
-
Writers
- Karen Fox (ADNET Systems, Inc.)
- Scott Wiessinger (USRA)
Missions
This page is related to the following missions:Series
This page can be found in the following series:Tapes
The media on this page originally appeared on the following tapes:-
Three years of SDO Sun Data
(ID: 2013043)
Monday, April 22, 2013 at 4:00AM
Produced by - Robert Crippen (NASA)
Datasets used
-
[SDO]
ID: 168This dataset can be found at: http://sdo.gsfc.nasa.gov/
See all pages that use this dataset -
AIA 304 (304 Filter) [SDO: AIA]
ID: 677This dataset can be found at: http://jsoc.stanford.edu/
See all pages that use this dataset -
AIA 193 (193 Filter) [SDO: AIA]
ID: 679This dataset can be found at: http://jsoc.stanford.edu/
See all pages that use this dataset -
AIA 171 (171 Filter) [SDO: AIA]
ID: 680This dataset can be found at: http://jsoc.stanford.edu/
See all pages that use this dataset -
AIA 4500 (4500 Filter) [SDO: AIA]
ID: 758This dataset can be found at: http://jsoc.stanford.edu/
See all pages that use this dataset
Note: While we identify the data sets used on this page, we do not store any further details, nor the data sets themselves on our site.
Related
- ID: 12144
 Produced Video
 - ID: 11270
 Produced Video
 - ID: 10996
 Produced Video
 - ID: 10886
 Produced Video
Release date
This page was originally published on Monday, April 22, 2013.
This page was last updated on Wednesday, May 3, 2023 at 1:52 PM EDT.