Earth
ID: 586
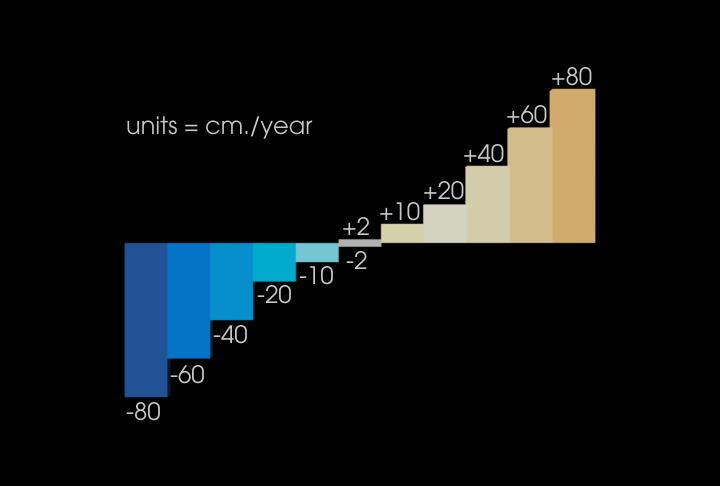
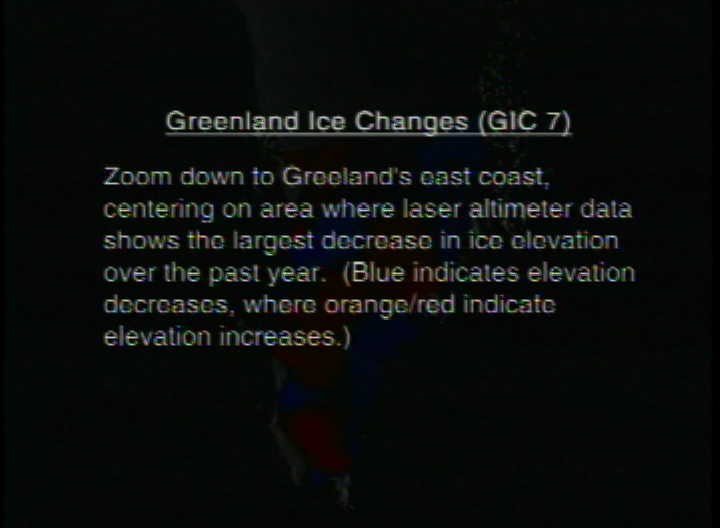
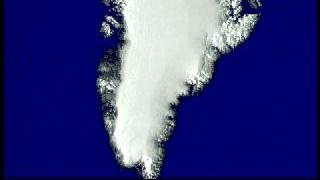
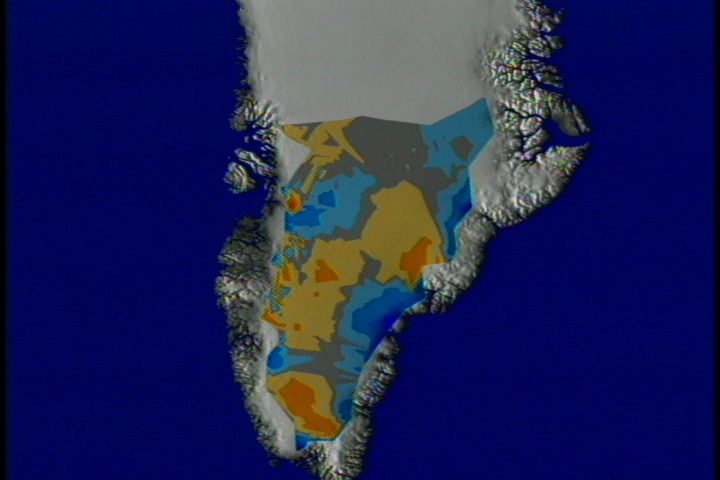
The largest decrease in ice elevation occurred on Greenland's east coast. Dark blue indicates the area of largest ice loss. This animation is match-moved to animation #585 and the reverse of #588.
Greenland: East Coast Zoom-down With Ice Data
Alternate Version
For More Information
Visualization Credits
Alex Kekesi (Global Science and Technology, Inc.): Lead Animator
William Krabill (NASA/GSFC Wallops): Scientist
William Krabill (NASA/GSFC Wallops): Scientist
Please give credit for this item to:
NASA/Goddard Space Flight Center Scientific Visualization Studio
NASA/Goddard Space Flight Center Scientific Visualization Studio
Science Paper:
W. Krabill, E. Frederick, S. Manizade, C. Martin, J. Sonntag, R. Swift, R. Thomas, W. Wright, and J. Yungel, Rapid Thinning of Parts of the Southern Greenland Ice Sheet, Science, 283, n5407, pp 1522-1524, March 5, 1999
Short URL to share this page:
https://svs.gsfc.nasa.gov/586
Data Used:
Note: While we identify the data sets used in these visualizations, we do not store any further details nor the data sets themselves on our site.
This item is part of this series:
Greenland
Goddard TV Tape:
G1999-016
Keywords:
DLESE >> Cryology
SVS >> Ice
SVS >> Laser Altimeter
GCMD >> Location >> Greenland
NASA Science >> Earth
GCMD keywords can be found on the Internet with the following citation: Olsen, L.M., G. Major, K. Shein, J. Scialdone, S. Ritz, T. Stevens, M. Morahan, A. Aleman, R. Vogel, S. Leicester, H. Weir, M. Meaux, S. Grebas, C.Solomon, M. Holland, T. Northcutt, R. A. Restrepo, R. Bilodeau, 2013. NASA/Global Change Master Directory (GCMD) Earth Science Keywords. Version 8.0.0.0.0
W. Krabill, E. Frederick, S. Manizade, C. Martin, J. Sonntag, R. Swift, R. Thomas, W. Wright, and J. Yungel, Rapid Thinning of Parts of the Southern Greenland Ice Sheet, Science, 283, n5407, pp 1522-1524, March 5, 1999
Short URL to share this page:
https://svs.gsfc.nasa.gov/586
Data Used:
Airborne Topographic Mapper
1993/06-1993/07, 1994/05-1994/06, 1998/06-1998/07, 1999/05This item is part of this series:
Greenland
Goddard TV Tape:
G1999-016
Keywords:
DLESE >> Cryology
SVS >> Ice
SVS >> Laser Altimeter
GCMD >> Location >> Greenland
NASA Science >> Earth
GCMD keywords can be found on the Internet with the following citation: Olsen, L.M., G. Major, K. Shein, J. Scialdone, S. Ritz, T. Stevens, M. Morahan, A. Aleman, R. Vogel, S. Leicester, H. Weir, M. Meaux, S. Grebas, C.Solomon, M. Holland, T. Northcutt, R. A. Restrepo, R. Bilodeau, 2013. NASA/Global Change Master Directory (GCMD) Earth Science Keywords. Version 8.0.0.0.0


