Greenland's Receding IceINTRODUCTION Less ice, more ocean. That's the troubling conclusion emerging from new NASA research to study the condition of Greenland's ice sheet. Using a laser altimeter repeatedly flown across the surface of Greenland, experts say the edges of the ice found there may be thinning at the rate of nearly one meter per year. Observation of change is one of the most sophisticated methods for understanding
the nature of something. In complex systems like the Earth's climate, researchers
examining specific features or processes can often extrapolate broader
understandings of the larger whole. The changing conditions surrounding
Greenland's ice cap are a good example of this. By measuring fluctuations,
experts look for clues into broader subjects like global warming and atmospheric
changes over time.
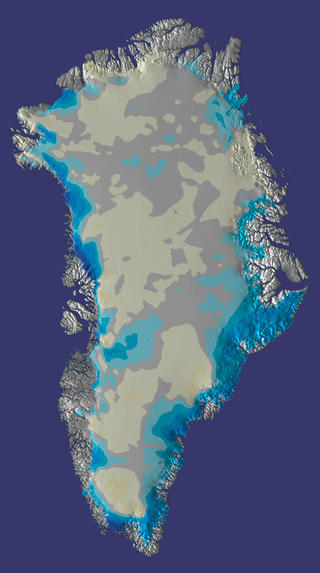
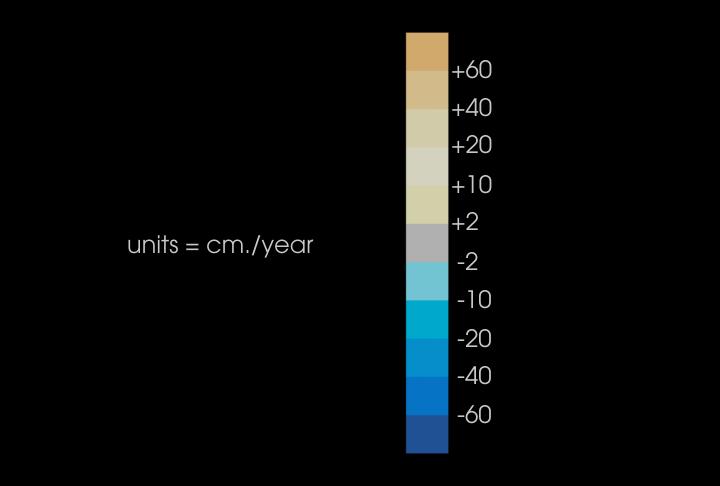
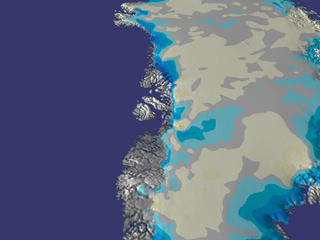
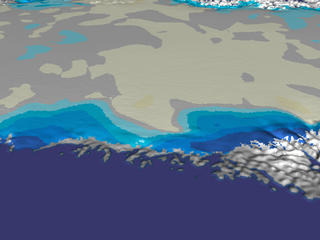
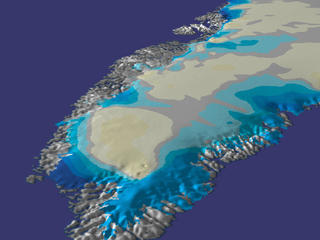
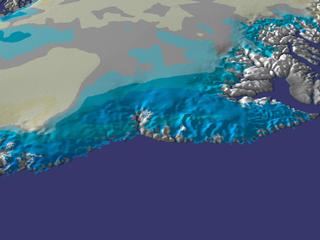
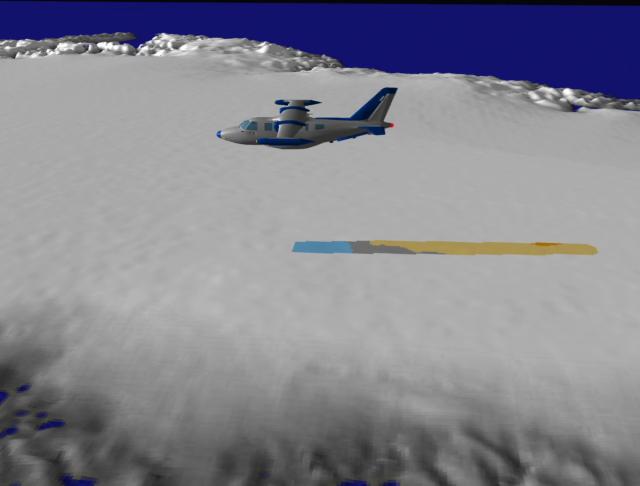
Rising and Falling Ice Levels In the following series of animations, blues indicate areas where the
loss of ice is greatest, and yellows indicate regions that are apparently
thickening. Gray areas indicate no significant change in ice thickness.
Greenland's Thinning Ice
View Images and Animations Based on new research using NASA's airborne laser altimeter, scientists have identified pronounced thinning of Greenland's ice cap. Notice how the thinning is most severe along the coasts, while the center of the landmass appears to thicken slightly. What's happening? After Antarctica, Greenland's ice cap contains the second largest mass of frozen freshwater in the world. This new research indicates enough ice loss to cause a measurable rise in sea levels. Quantified conservatively, the study indicates a net loss of roughly 51 cubic kilometers of ice per year from the entirety of the Greenland ice sheet. That's enough to raise the average sea level worldwide about .13 millimeters per year. While that might not sound like much, consider that in the space of only a single lifetime, it's nearly 1 centimeter of rise, and that's only if we assume the rate of increase remains the same. Experts know there have been significant changes to the planet's ice caps and oceans in geologically recent history. Since the last interglacial period (The Eemian) roughly 110,000 to 130,000 years ago, the sea level has risen approximately four meters. What's important is a better understanding of how human and natural processes are conjoined to affect changes in the important ice caps of the world we know today. The picture of change on Greenland's ice sheet is not simple, however. As you look at the attending maps, notice how much of the interior landmass is covered by wide areas of pale yellow. These indicate areas where the ice level is rising. The science of this phenomenon is fascinating. As ice melts near the coast, it gives up moisture to the surrounding atmosphere, raising its potential energy as the humidity rises. As it's also a lower altitude, the air is warmer, and thus it rises. Up on the wide, flat plains of ice that make up the majority of Greenland's surface, that moisture rich air cools when it reaches the comparatively higher altitude, and the air gives up its moisture in the form of snow. Gradually that snow builds up into ice, hence the apparent increase on the maps shown here. As it turns out, the thickening ice in the center is itself evidence of disappearing ice over the rest of the continent. The study of Greenland's ice is another example of how a somewhat localized
phenomenon is providing insight to climate systems that relate to the entire
planet. Only with continued observations will more comprehensive understanding
of the trends there be determined.
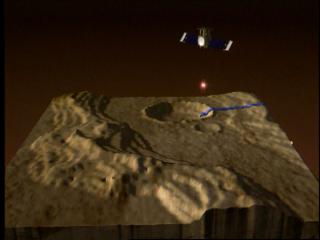
LIDAR - Using Light to Measure Height Lidar is a distance measuring system similar to radar, except that instead of radio waves it uses pulses of laser light for range finding. In fact, lidar derives from the words light and radar. The instrument determines precise distances by measuring the amount of time necessary for a pulse of light to leave an emitter, hit a target, and return. In this case, distance measurements helped researchers determine changes in ice thickness. LIDAR: Measuring Terrain
on Earth and Elsewhere
View Images and Animations Lidar offers diverse scientific disciplines powerful tools for
exploration. Besides being used to study Greenland?s ice cap, lidar has
been used to study erosion on both the east and west coast.
Additionally, a lidar system managed by the Goddard Space Flight Center
is currently orbiting Mars as part of the Mars Global Surveyor
spacecraft, engaged in a detailed mapping project of the red planet.
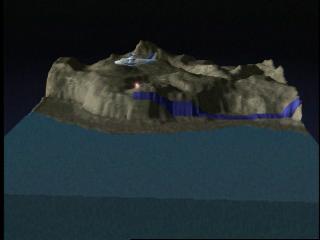
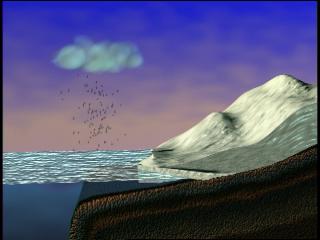
Crisscrossing Greenland by Airplane Initial research into Greenland ice began in 1993 and 1994 when a team from NASA's Wallops Island Flight Facility surveyed the area using the agency's Airborne Topographic Mapper (ATM), a lidar system. Flying an aging but sturdy aircraft called a P-3B, altitude measurements were taken again in 1998 and 1999 for comparison. The tracks of the airplane could be closely duplicated because of a highly precise GPS system flown onboard. This was important for the purpose of careful evaluation of the nature of the ice pack and its thickness. Minor errors in navigation would have compared slightly different locations on the ice. A large number of the flights were east-west traverses, proscribed by the limits of the aircraft's range and the location of two of Greenland's primary air stations, Kangerlussuaq and Thule Air Base. Ice: The Planet's Thermostat (Animation) The study of ice in Greenland has significance for the rest of our planet. It's one-seventh the size of Antarctica, but because it protrudes into more temperate latitudes, it may be a better indicator of climate change than the larger landmass found in the south. Global ice cover acts as the planet's thermostat, regulating temperature by reflecting sunlight back into space. It also holds most of the Earth's fresh water (water that would otherwise swamp what are now coastal lowlands around the world). In this animation, we begin with a view of Greenland as it may have looked 100,000 years ago. A thick ice cap covers the outline of Greenland far beyond the actual boundaries of the landmass itself. Moving in closer, notice what happens as the climate begins to warm. Glaciers surrounding the edge of Greenland begin to melt, adding billions of gallons to the oceans. As the water rises and the ice recedes, warming continues around the planet, in part exacerbated by a growing paucity of ice to reflect warming sunlight back into space. Shown here, notice how the humid air above the place where the ice is melting causes the formation of clouds, which rise up onto the main portion of the land due to convection. There, at higher elevation, the moist air condenses and snow precipitates out, causing a slight rise in surface height in the interior. What we see as the camera ultimately pulls back is a Greenland that no longer has as thick or expansive ice cap. Notice how much of the ice perimeter is now inside the boundary of the landmass. The land itself has not changed significantly (at least not in the context of this research), but the effective surface area and volume of the ice associated with that land is now significantly smaller. While researchers agree that there have been significant changes to
Greenland's ice in the planet's past, they are uncertain about the state
of change found there now. A team of experts from NASA's Wallops Island
Flight Facility conducted this research mission. One of the most important
things they are trying to determine is how much of the currently visible
change is a function of natural processes and how much is influenced by
human factors.
Airborne Researchers Measure
Greenland's Ice (Reporter package)
Greenland's coastal ice is disappearing fast enough that at its current rate of decline it will contribute to a rise in the world's oceans of a little less than a centimeter in the space of a single human lifetime. That's the finding of new research conducted by experts based at NASA's Wallops Island Flight Facility. Flying a specially outfitted P-3B aircraft across the Danish territory, they used a laser to measure ice thickness there. By comparing changes in ice thickness taken in 1999 to measurements made earlier in the decade, they concluded that the continent is giving up nearly 50 gigatons--that's 50 billion tons--of water per year, with greatest losses coming from the eastern coast. Climate change presents challenges to researchers because it often
concerns combinations of many interrelated processes. But Greenland may be
for climatologists what canaries used to be for miners: an early warning
monitor. Though only one-seventh the size of Antarctica, Greenland protrudes
into more temperate latitudes, and may be a better indicator of climate
change than the land around the south pole. Global ice cover acts as the
planet's thermostat, regulating temperature by reflecting sunlight back into
space. It also holds much of the Earth's fresh water, water that if melted
would otherwise swamp what are now coastal lowlands around the world.
This multimedia project is the work of a dedicated team of researchers, animators, and media specialists. A companion video to this web site is available from NASA-TV. Below are a list of agencies, departments, and researchers who provided expertise and data for this production:
Please give credit for these images to: |