Ocean Color Imagery
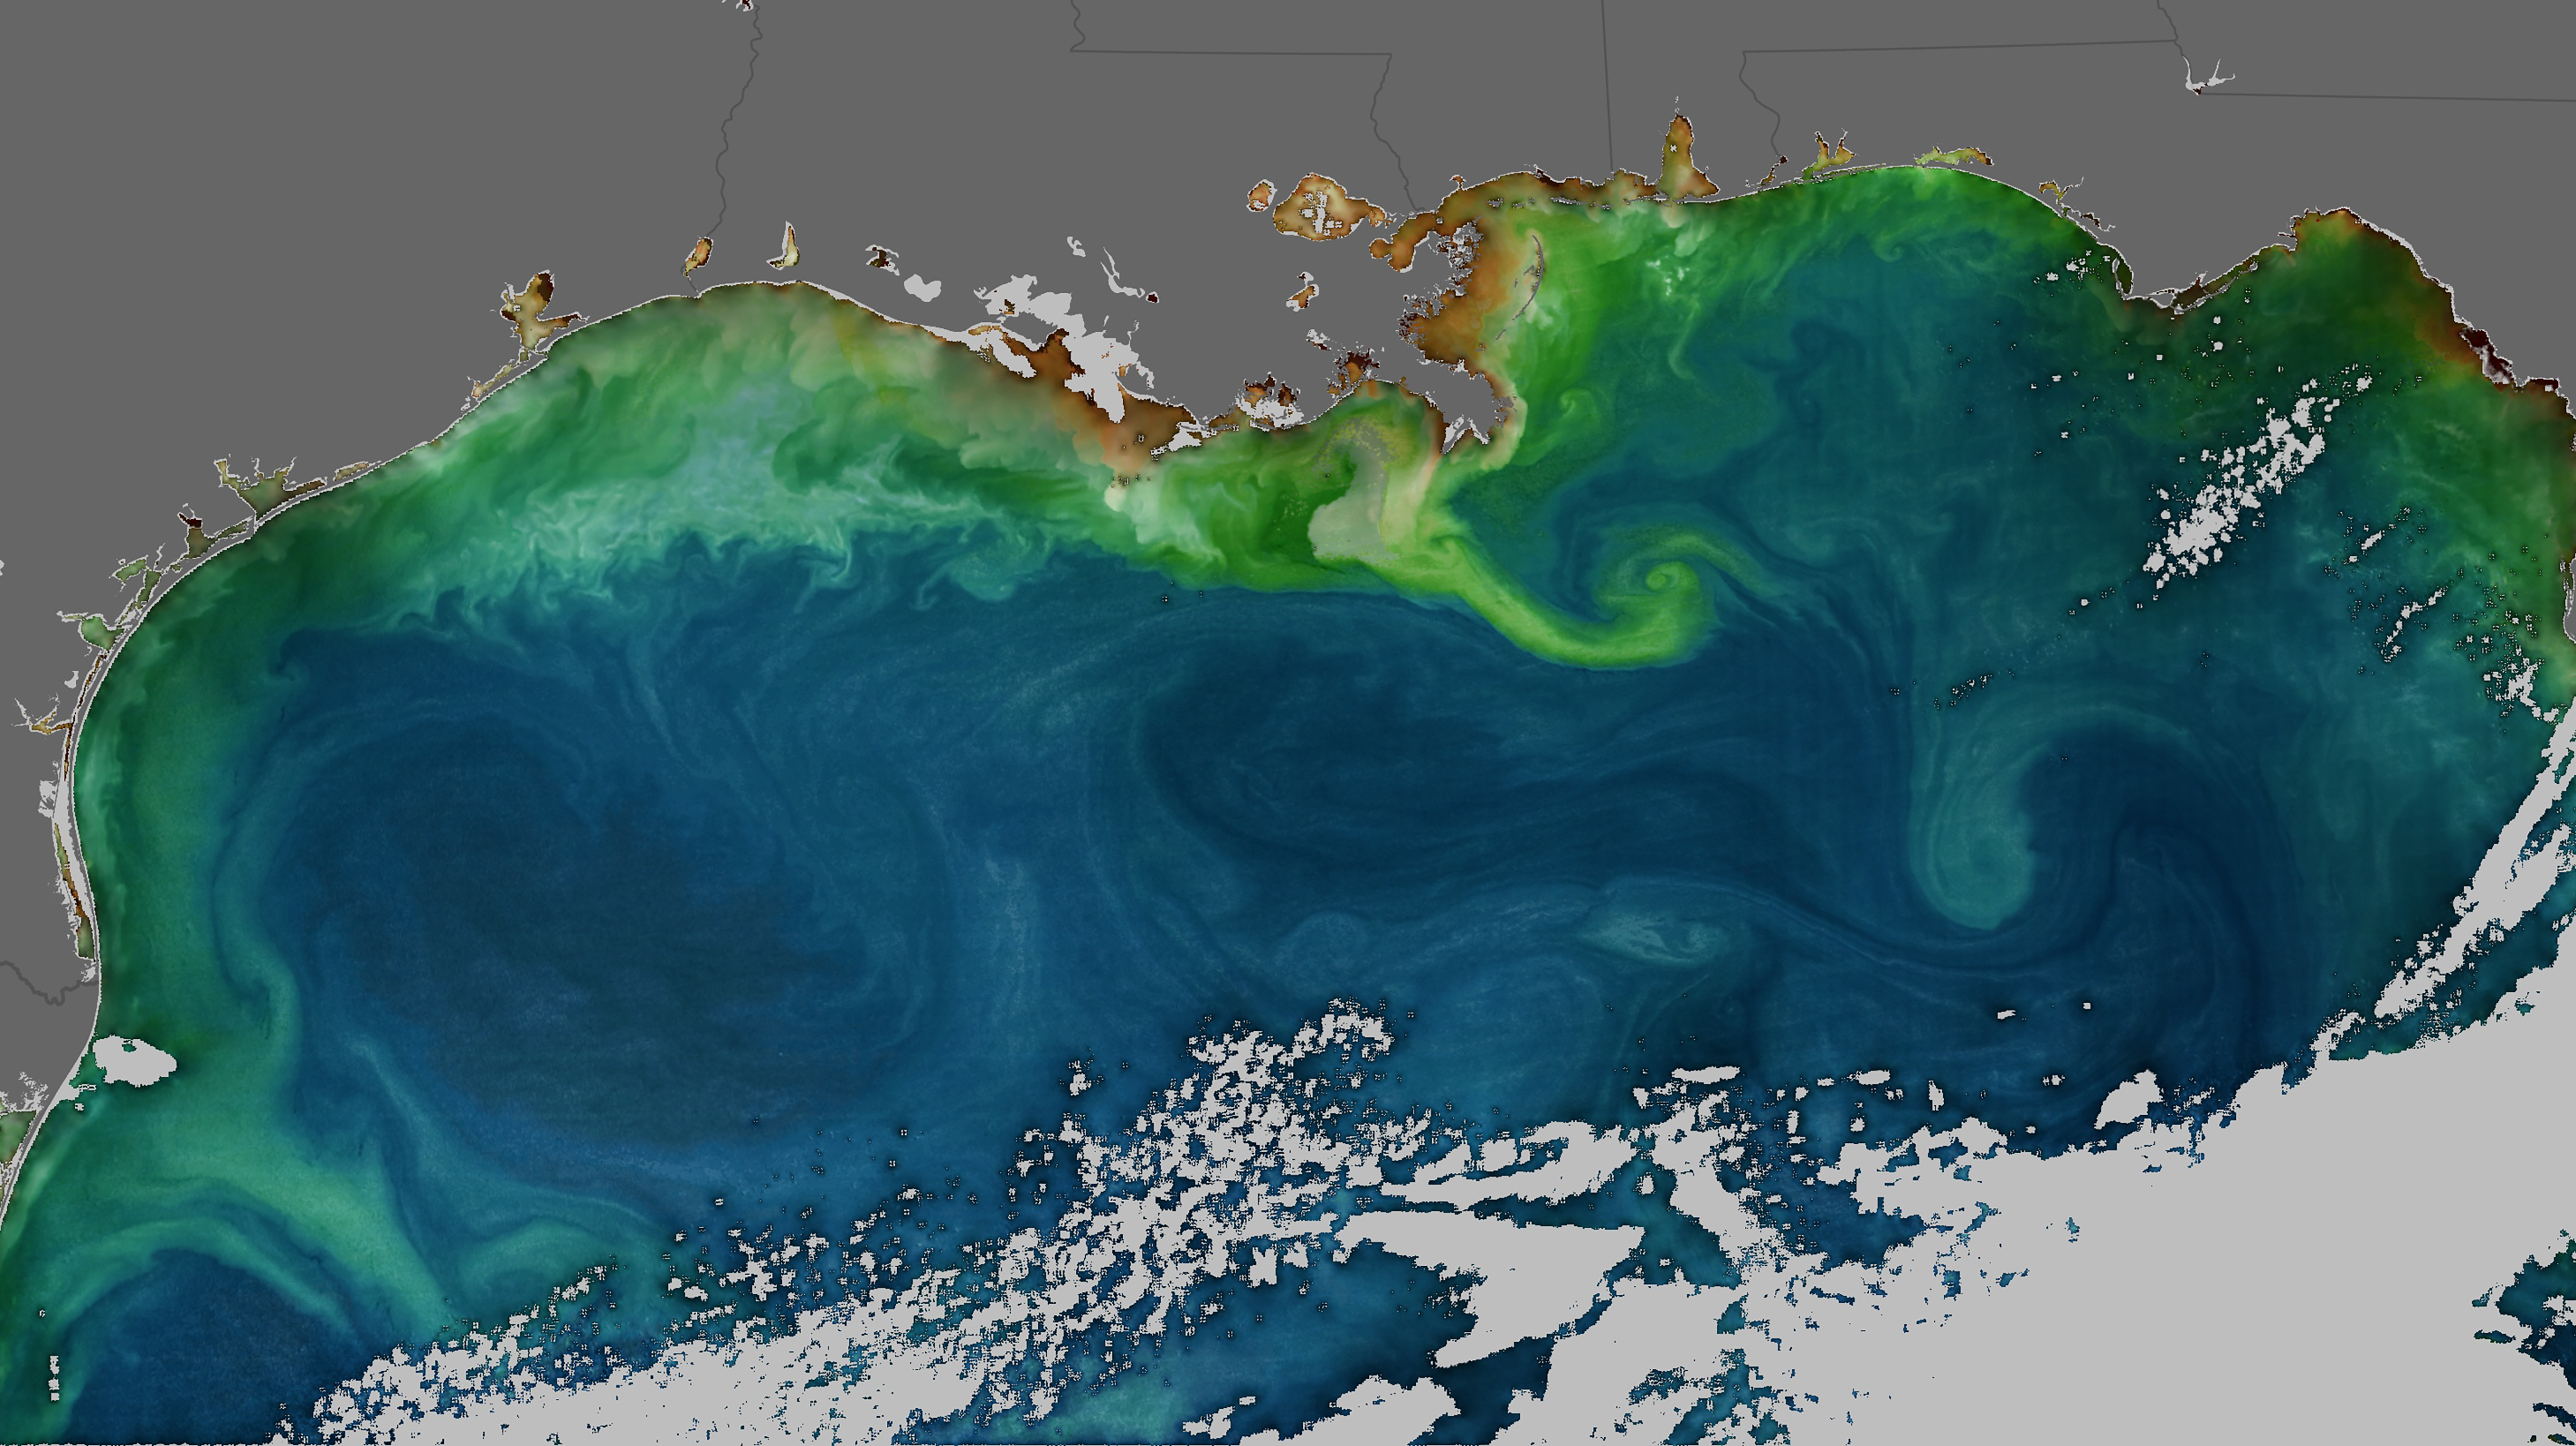
Gulf of Mexico
This image of the northern Gulf of Mexico was created from remote-sensing reflectance and chlorophyll measurements taken from newly reprocessed VIIRS data collected on October 15, 2014.
For more information, visit: oceancolor.gsfc.nasa.gov/cgi/image_archive.cgi?c=ALL

South Georgia Island
This Landsat 8 image was collected on February 19, 2016
For more information, visit: entry #30783
Malacca Strait
This Landsat 8 image was collected on February 16, 2015
For more information visit: entry #30783

Prince Edward Islands Plume
The topographic effect of the Prince Edward Islands in the predominantly eastward flowing currents of the southwestern Indian Ocean along with input of nutrients from the volcanic soils of the islands themselves and significant runoff of seabird and seal guano in the abundant local rainfall often results in a down-current plume of relatively high chlorophyll concentrations.
Farther north, the higher chlorophyll associated with the Agulhas Return Current is visible. North of that a cyclonic, cold-core eddy stands out from its low chlorophyll surroundings.
For more information, visit: oceancolor.gsfc.nasa.gov/cgi/image_archive.cgi?c=ALL
Speke Gulf, Lake Victoria
This Landsat 8 image was collected on January 6, 2016
For more information, visit: entry #30783

Ganges Delta
This Landsat 8 image was collected on December 18, 2014
For more information, visit: entry #30783
Kuwait
This Landsat 8 image was collected on October 14, 2015
For more information, visit: entry #30783
Gulf of Bothnia
This Landsat 8 image was collected on May 18, 2015
For more information, visit: entry #30783

Hokkaido
The Japanese island of Hokkaido may have still been largely snow covered, but the surrounding ocean was blooming on April 3, 2009. The cold Oyashio current flows past the island bringing a rich nutrient supply from the north which feeds phytoplankton powered by the spring sunshine. The warm Kuroshio Current collides with the Oyashio near the bottom right of the above image and both turn eastward to become the North Pacific Current.
For more information, visit: oceancolor.gsfc.nasa.gov/cgi/image_archive.cgi?c=ALL
Congo River
This Landsat 8 image was collected on March 2, 2015
For more information, visit: entry #30783

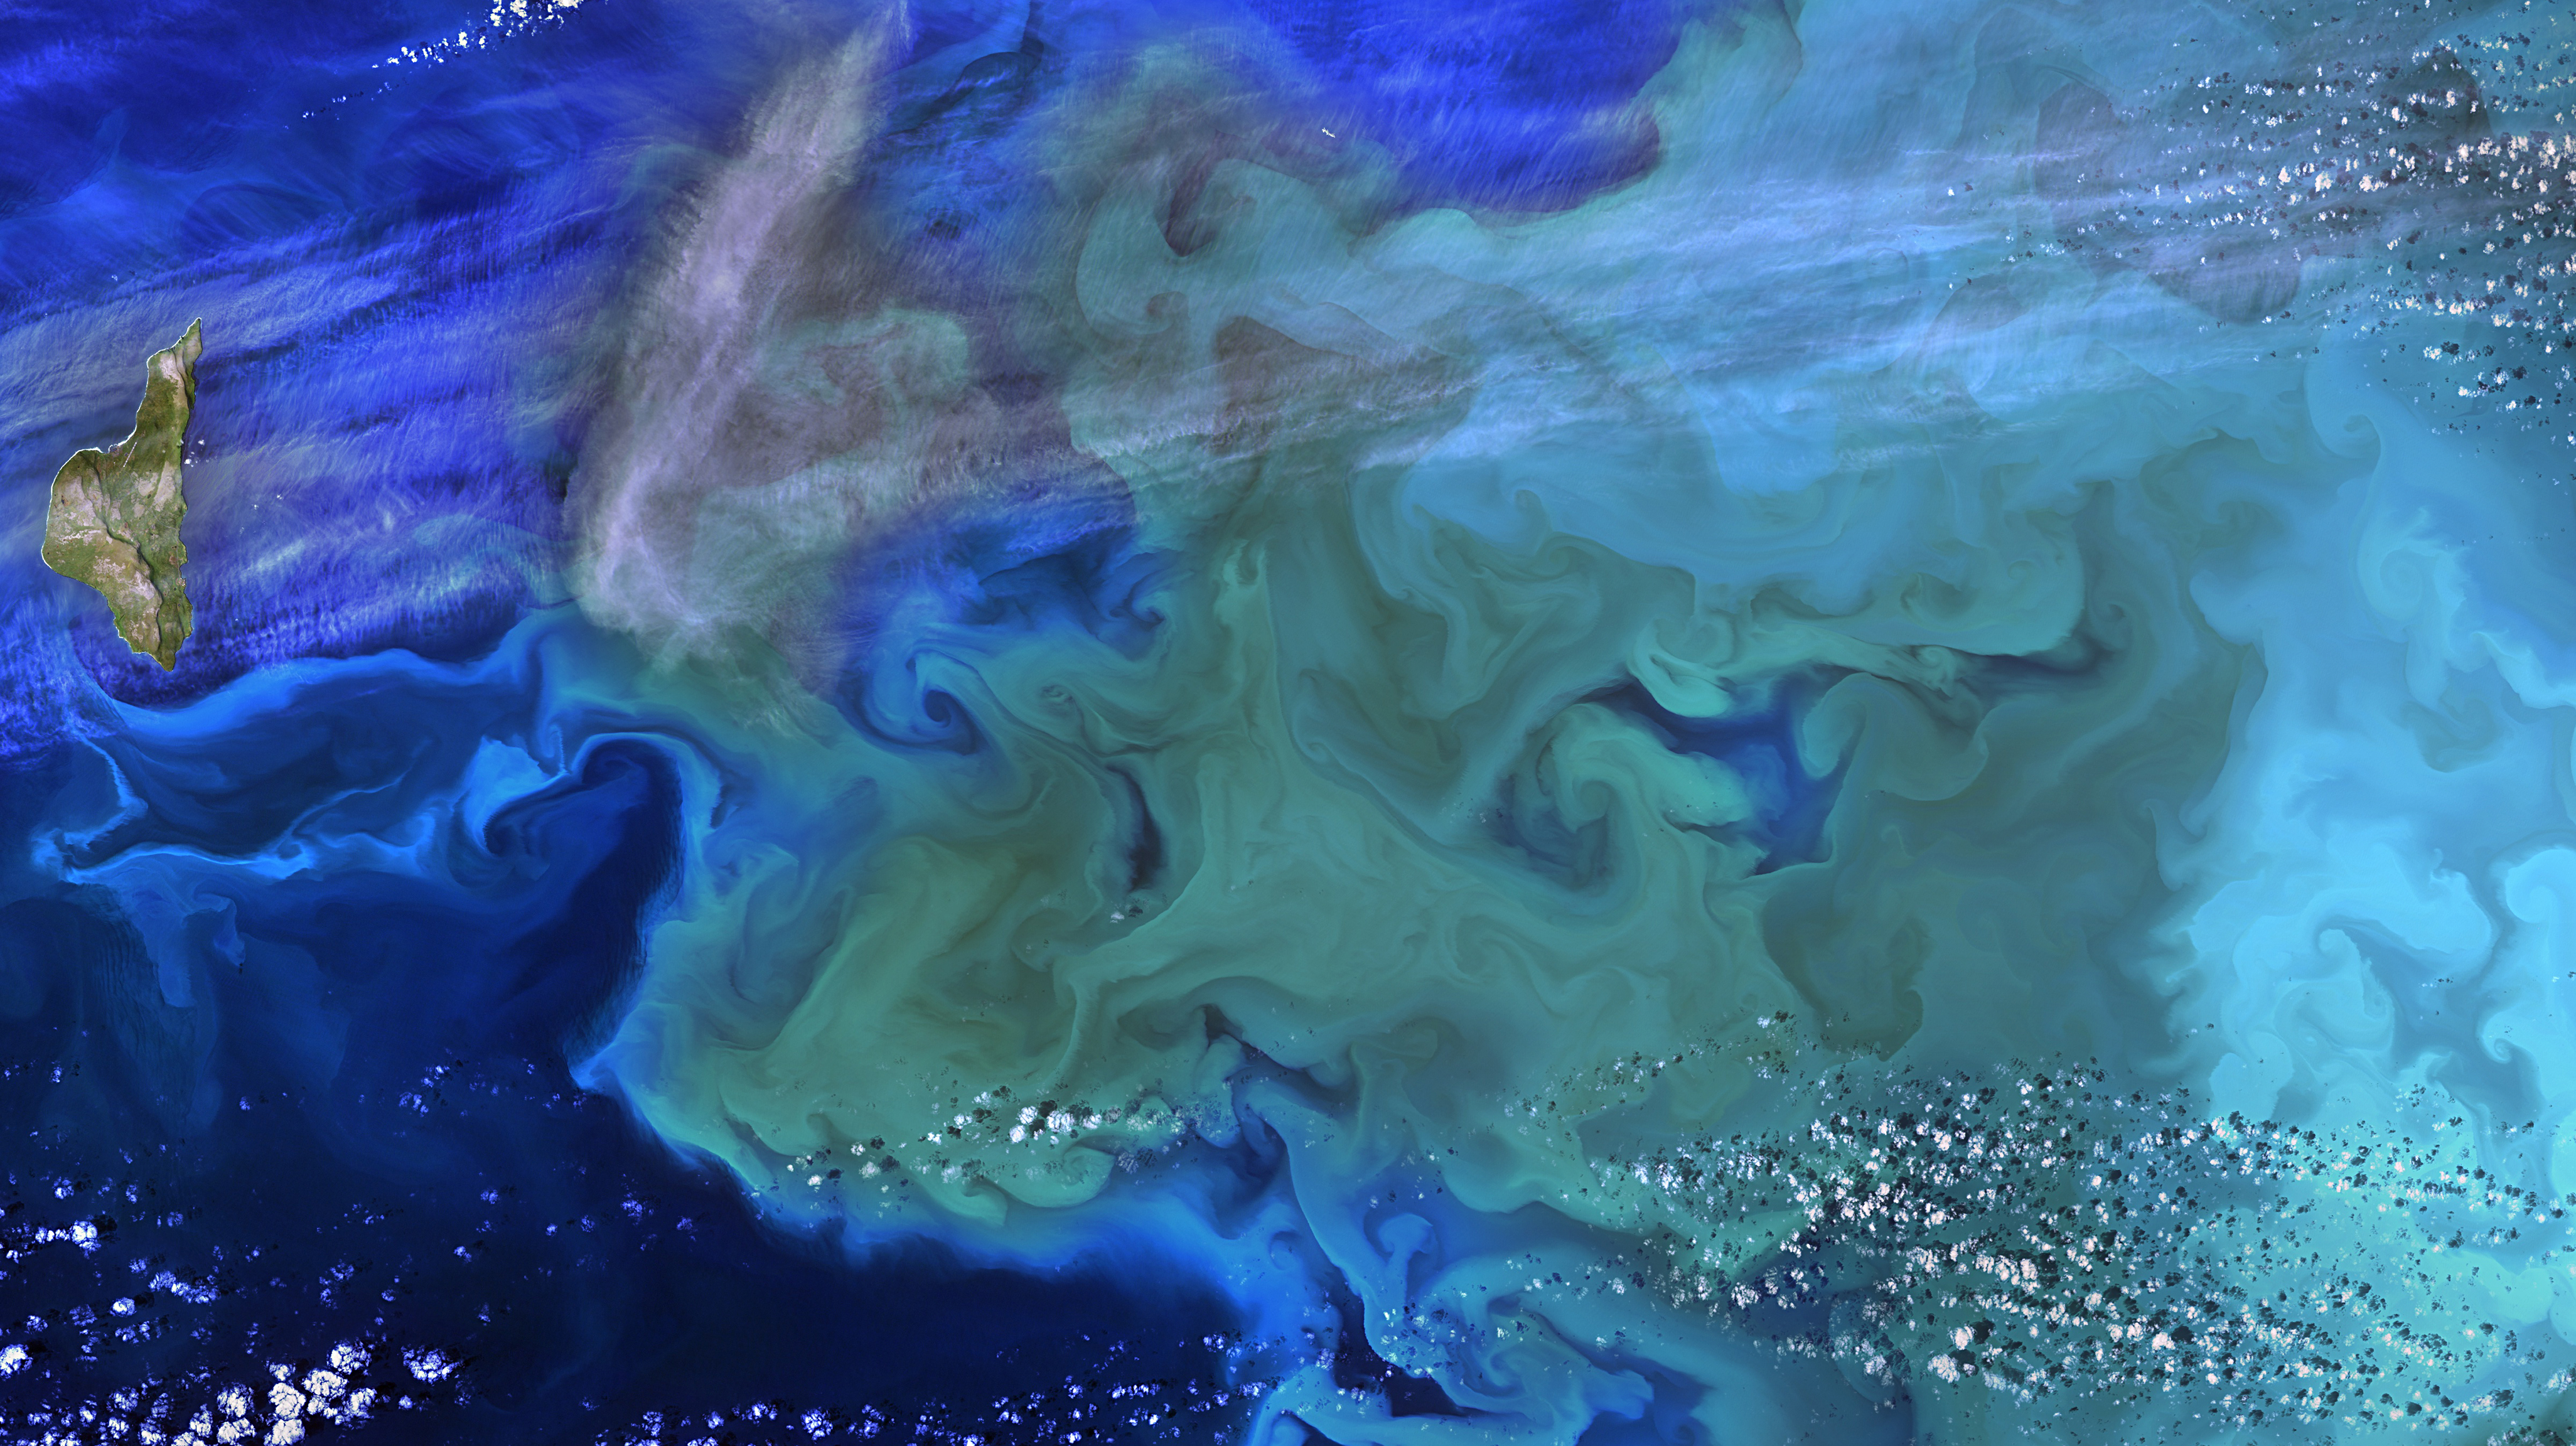
Arabian Sea Winter Blooms
Filamentous green swirls fill the northern Arabian Sea in February 2015. Recent research in the area has found that while winter blooms used to be dominated by diatoms, they are now largely composed of dinoflagellates -- a change that may have significant effects on the food web.
For more information, visit: oceancolor.gsfc.nasa.gov/cgi/image_archive.cgi?c=ALL
Mississippi River Delta
This Landsat 8 image was collected on January 12, 2014
For more information visit: entry #30783
Thames Estuary
This Landsat 8 image was collected on October 30, 2013
For more information, visit: entry #30783

Baltic Sea Graticule
This Landsat 8 image was collected on August 10, 2015
For more information, visit: entry #30783
Pribilof Islands
This Landsat 8 image was collected on September 22, 2014
For more information, visit: entry #30783
Chesha Bay
This Landsat 8 image was collected on May 18, 2015
For more information, visit: entry #30783
Lagoa Dos Patos
This Landsat 8 image was collected on May 31, 2015
For more information, visit: entry #30783

New Zealand
The patchiness exhibited by phytoplankton communities around New Zealand in this image provides the raison d'être for satellite remote sensing of ocean color; a whole fleet of ships, drifters, gliders, and buoys could not capture this variability before it morphed into a new pattern.
This image was collected by VIIRS image collected on September 30, 2015.
For more information, visit: oceancolor.gsfc.nasa.gov/cgi/image_archive.cgi?c=ALL
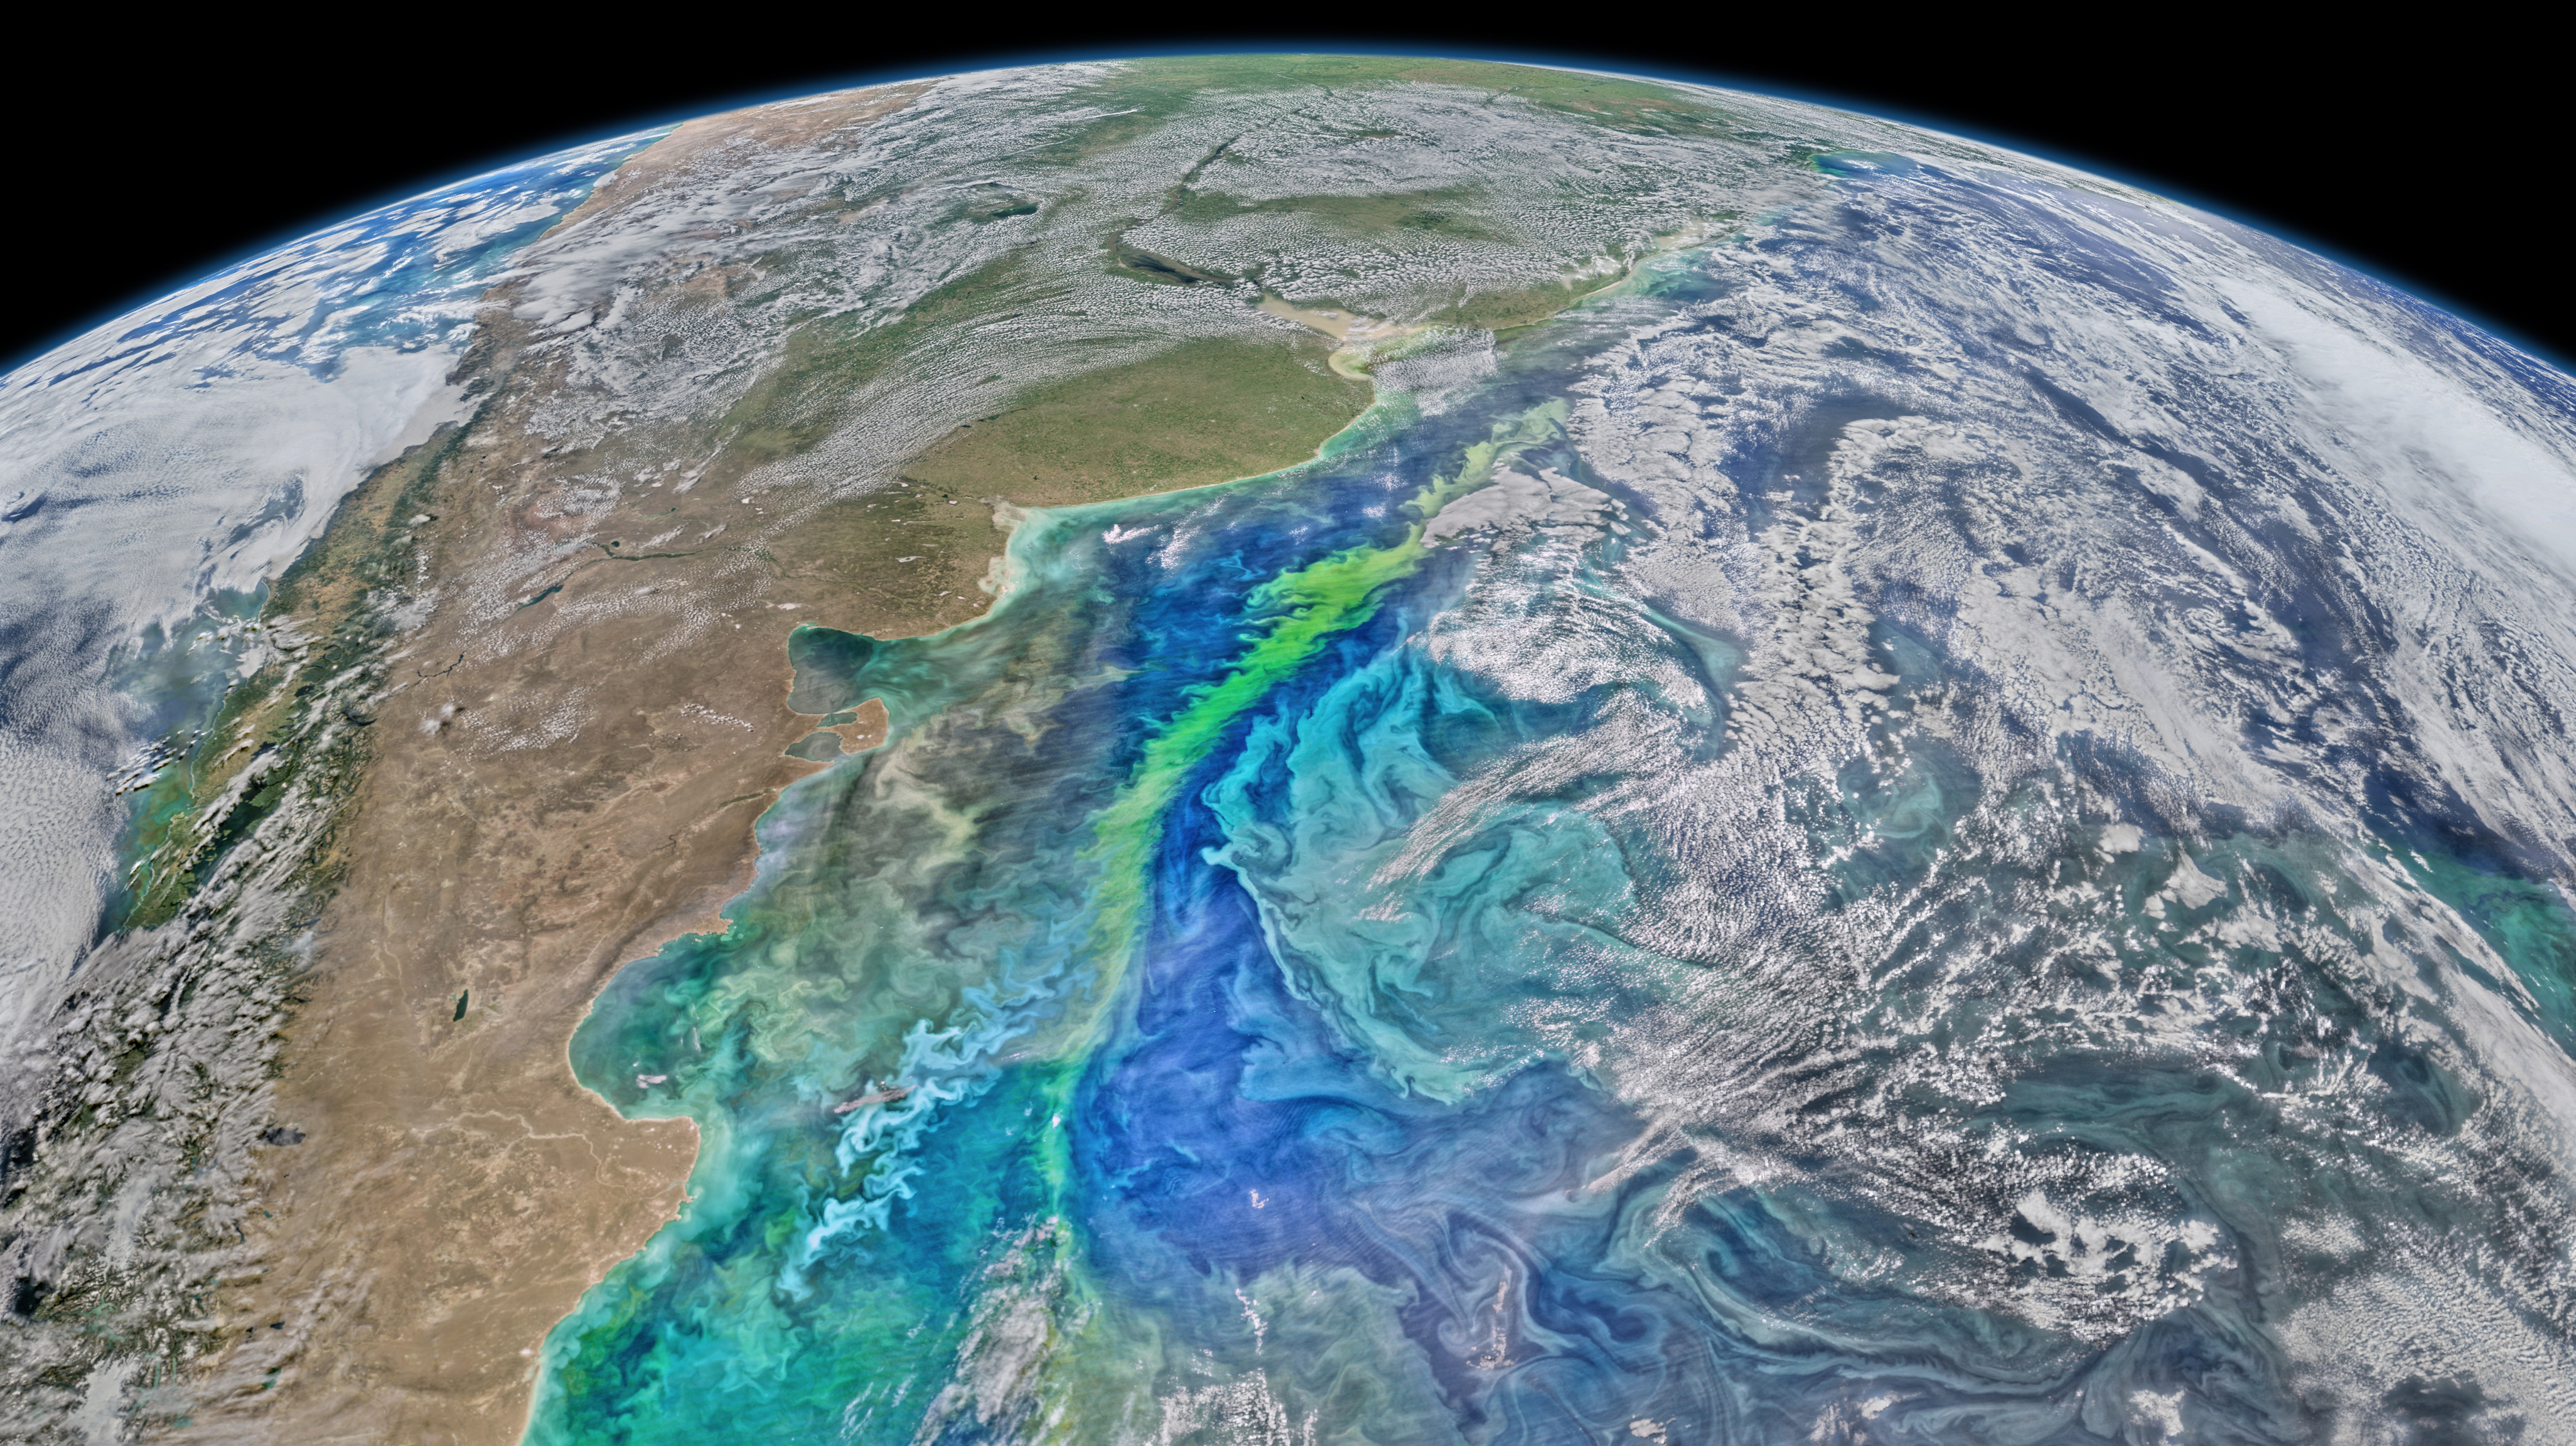
Patagonian Sea
The Patagonian Sea is "one of the most biologically productive regions in the global ocean". Recent studies show chlorophyll concentrations have increased there over the past seventeen years.
This VIIRS image was collected on March 12, 2016.
For more information, visit: oceancolor.gsfc.nasa.gov/cgi/image_archive.cgi?c=ALL
Sea of Marmara
This Landsat 8 image was collected on May 16, 2015
For more information, visit: entry #30783
Lena Delta
This Landsat 8 image was collected on July 16, 2013
For more information visit: entry #30783
Croatia
This Landsat 8 image was collected on December 16, 2015
For more information, visit: entry #30783

Barents Sea
Recent work suggests that diatoms predominate during May in the Barents Sea while coccolithophores bloom in August. This MODIS scene, collected on July 10, 2014, may show those arctic waters in transition between greener diatom-dominated and milkier coccolithophore-dominated waters.
Ocean colors in the above image represent remote-sensing reflectance in the red, green, and blue portions of the spectrum. Green and blue reflectances have been scaled the same way, but the red reflectance has been scaled brighter to accentuate differences in this relatively dark portion of the spectrum. (Note that positive identification of phytoplankton species is not possible from these data alone; sea-surface sampling would be required for that.)
For more information, visit: oceancolor.gsfc.nasa.gov/cgi/image_archive.cgi?c=ALL
Tyuleni Archipelago
This Landsat 8 image was collected on April 7, 2016
For more information, visit: entry #30783
Atlantic Phytoplankton
This image was collected on June 3, 2016.
For more information visit:
Credits
Please give credit for this item to:
NASA's Goddard Space Flight Center
-
Project support
- Amy Moran (Global Science and Technology, Inc.)
- Marit Jentoft-Nilsen
Release date
This page was originally published on Monday, June 13, 2016.
This page was last updated on Tuesday, November 14, 2023 at 12:32 AM EST.