Seeing Earth's Magnetism

NASA spacecraft fly through a magnetic explosion in space, and scientists visualize the result.
On October 16, 2015, four spacecraft of NASA’s MMS mission made the first observations of what happens when magnetic fields around Earth connect and explosively realign. The process, called magnetic reconnection, occurs near the boundary where Earth’s protective magnetic environment, known as the magnetosphere, encounters the sun’s solar wind. The rearrangement of magnetic field lines happens in the blink of an eye, and can unleash a massive burst of energy that accelerates charged particles from the sun into the magnetosphere. To measure the behavior of these particles and changes to Earth’s magnetic field, the MMS observatories are equipped with a total of 100 sensors that gather multiple data points every second as they travel through known reconnection sites in space. Now, scientists have used this data to create a visualization that shows the flow of particles before, during and after magnetic reconnection. Because magnetic reconnection is one of the prime drivers of space radiation, it is a key factor in the quest to learn more about our space environment and protect our spacecraft and astronauts as we explore farther and farther from our home planet. Understanding how particles move during these events can also help scientists create improved models that predict space weather. Watch the video to see the visualization.
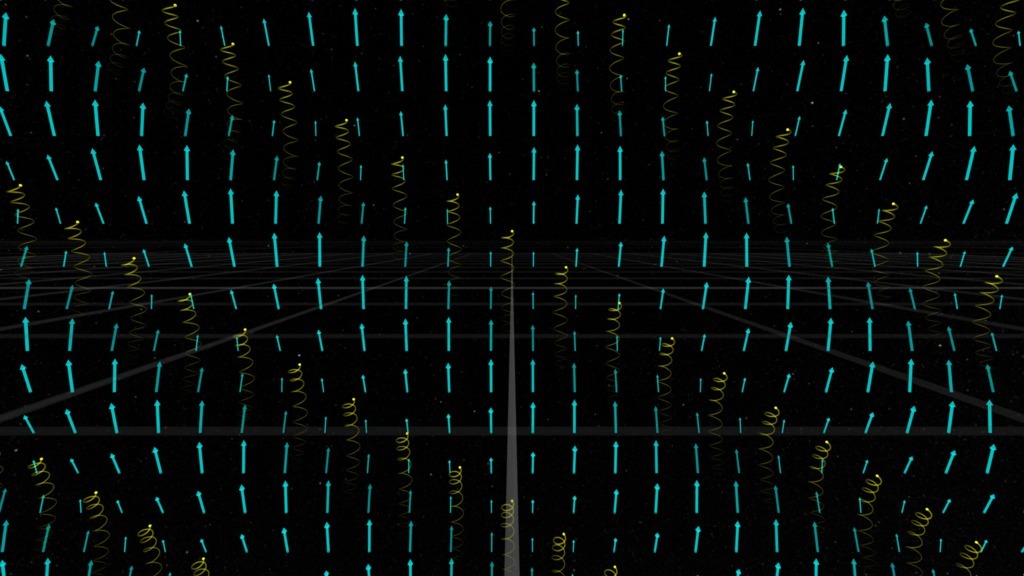
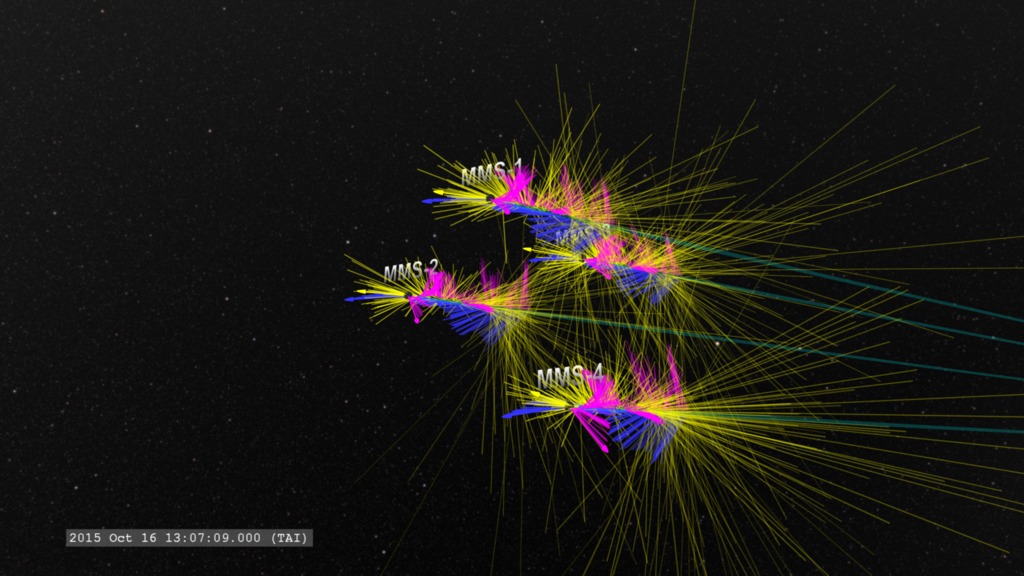
In this visualization, lines colored magenta indicate the orientation of Earth’s magnetic field; blue and yellow show the motion of particles.
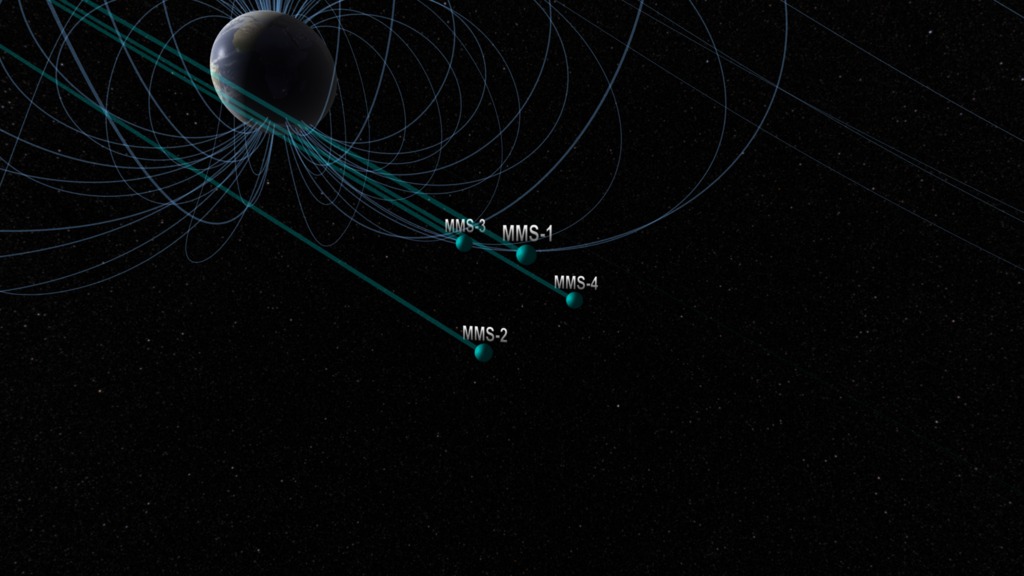
The four MMS spacecraft fly in a pyramid formation as they orbit Earth, allowing scientists to create a full 3-D map of any phenomena they observe.
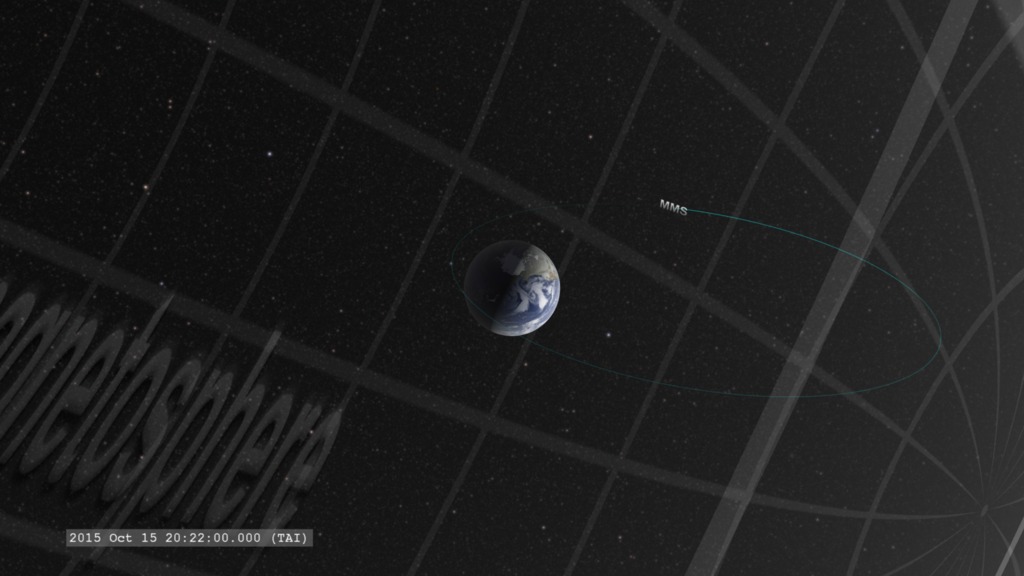
This image shows a snapshot of Earth's magnetic environment just before the MMS spacecraft traveled through a magnetic reconnection event.
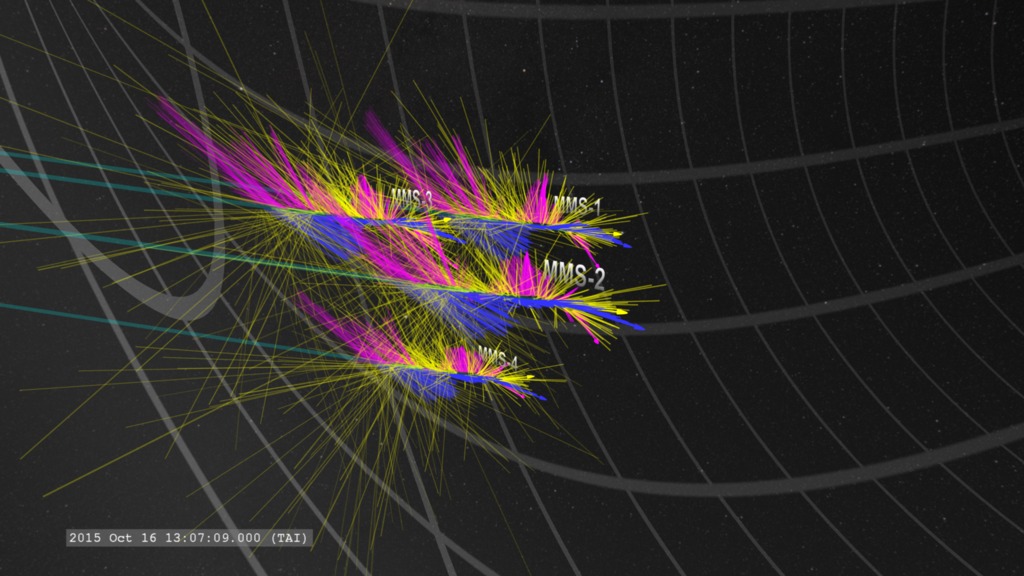
The image shows how it looked during the event. The chaotic blue and yellow lines depict the speed and direction of accelerated particles.
Credits
Please give credit for this item to:
NASA's Scientific Visualization Studio
Cover image courtesy of NASA/GSFC
Spacecraft formation image courtesy of NASA/GSFC
-
Writer
- Karen Fox (ADNET Systems, Inc.)
-
Animator
- Tom Bridgman (Global Science and Technology, Inc.)
-
Producer
- Genna Duberstein (USRA)
-
Scientist
- Thomas Moore (NASA/GSFC)
Release date
This page was originally published on Tuesday, June 14, 2016.
This page was last updated on Wednesday, May 3, 2023 at 1:48 PM EDT.
Related
- ID: 12618
 Produced Video
Sources
- ID: 4453
 Visualization
 - ID: 4454
 Visualization
 - ID: 4460
 Visualization
 - ID: 4333