SDO: Year One
April 21, 2011 marks the one-year anniversary of the Solar Dynamics Observatory (SDO) First Light press conference, where NASA revealed the first images taken by the spacecraft.
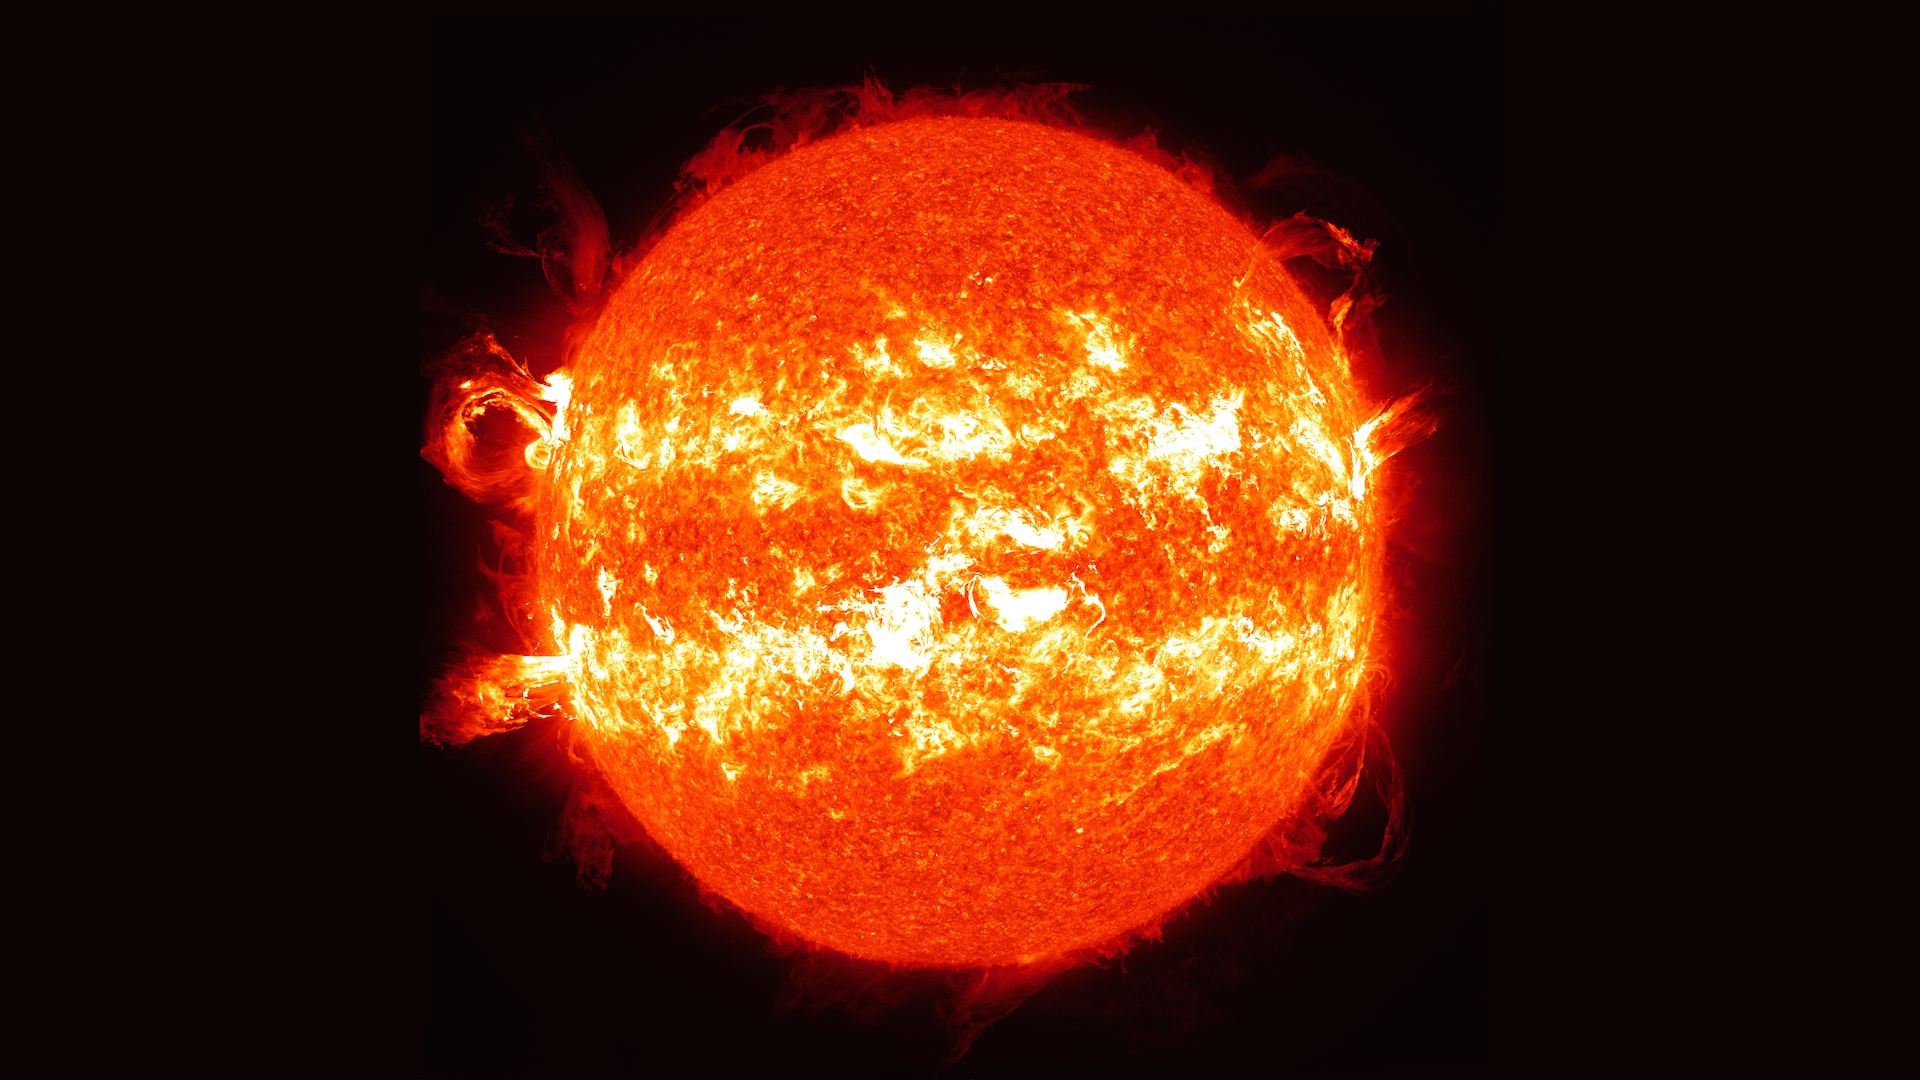
In the last year, the sun has gone from its quietest period in years to the activity marking the beginning of solar cycle 24. SDO has captured every moment with a level of detail never-before possible. The mission has returned unprecedented images of solar flares, eruptions of prominences, and the early stages of coronal mass ejections (CMEs). In this video are some of the most beautiful, interesting, and mesmerizing events seen by SDO during its first year.
In the order they appear in the video the events are:
1. Prominence Eruption from AIA in 304 Ångstroms on March 30, 2010
2. Cusp Flow from AIA in 171 Ångstroms on February 14, 2011
3. Prominence Eruption from AIA in 304 Ångstroms on February 25, 2011
4. Cusp Flow from AIA in 304 Ångstroms on February 14, 2011
5. Merging Sunspots from HMI in Continuum on October 24-28, 2010
6. Prominence Eruption and active region from AIA in 304 Ångstroms on April 30, 2010
7. Solar activity and plasma loops from AIA in 171 Ångstroms on March 4-8, 2011
8. Flowing plasma from AIA in 304 Ångstroms on April 19, 2010
9. Active regions from HMI in Magnetogram on March 10, 2011
10. Filament eruption from AIA in 304 Ångstroms on December 6, 2010
11. CME start from AIA in 211 Ångstroms on March 8, 2011
12. X2 flare from AIA in 304 Ångstroms on February 15, 2011

Additional still.
Credits
Please give credit for this item to:
NASA/Goddard Space Flight Center/SDO
-
Video editor
- Scott Wiessinger (UMBC)
-
Producer
- Scott Wiessinger (UMBC)
-
Scientist
- Barbara Thompson (NASA/GSFC)
-
Writer
- Barbara Thompson (NASA/GSFC)
Release date
This page was originally published on Thursday, April 21, 2011.
This page was last updated on Wednesday, May 3, 2023 at 1:53 PM EDT.
Missions
This visualization is related to the following missions:Series
This visualization can be found in the following series:Tapes
This visualization originally appeared on the following tapes:-
SDO-Year One
(ID: 2011039)
Thursday, April 21, 2011 at 4:00AM
Produced by - Robert Crippen (NASA)
Datasets used in this visualization
-
SDO Continuum (Continuum) [SDO: HMI]
ID: 674 -
SDO Magnetogram (Magnetogram) [SDO: HMI]
ID: 675 -
AIA 304 (304 Filter) [SDO: AIA]
ID: 677This dataset can be found at: http://jsoc.stanford.edu/
See all pages that use this dataset -
AIA 211 (211 Filter) [SDO: AIA]
ID: 678This dataset can be found at: http://jsoc.stanford.edu/
See all pages that use this dataset -
AIA 171 (171 Filter) [SDO: AIA]
ID: 680This dataset can be found at: http://jsoc.stanford.edu/
See all pages that use this dataset
Note: While we identify the data sets used in these visualizations, we do not store any further details, nor the data sets themselves on our site.
Related
- ID: 11742
 Produced Video
 - ID: 11745
 Produced Video
 - ID: 11460
 Produced Video