SDO: Year 4
The sun is always changing and NASA's Solar Dynamics Observatory is always watching. Launched on Feb. 11, 2010, SDO keeps a 24-hour eye on the entire disk of the sun, with a prime view of the graceful dance of solar material coursing through the sun's atmosphere, the corona. SDO's fourth year in orbit was no exception: NASA is releasing a movie of some of SDO's best sightings of the year, including massive solar explosions and giant sunspot shows.
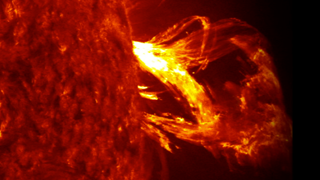
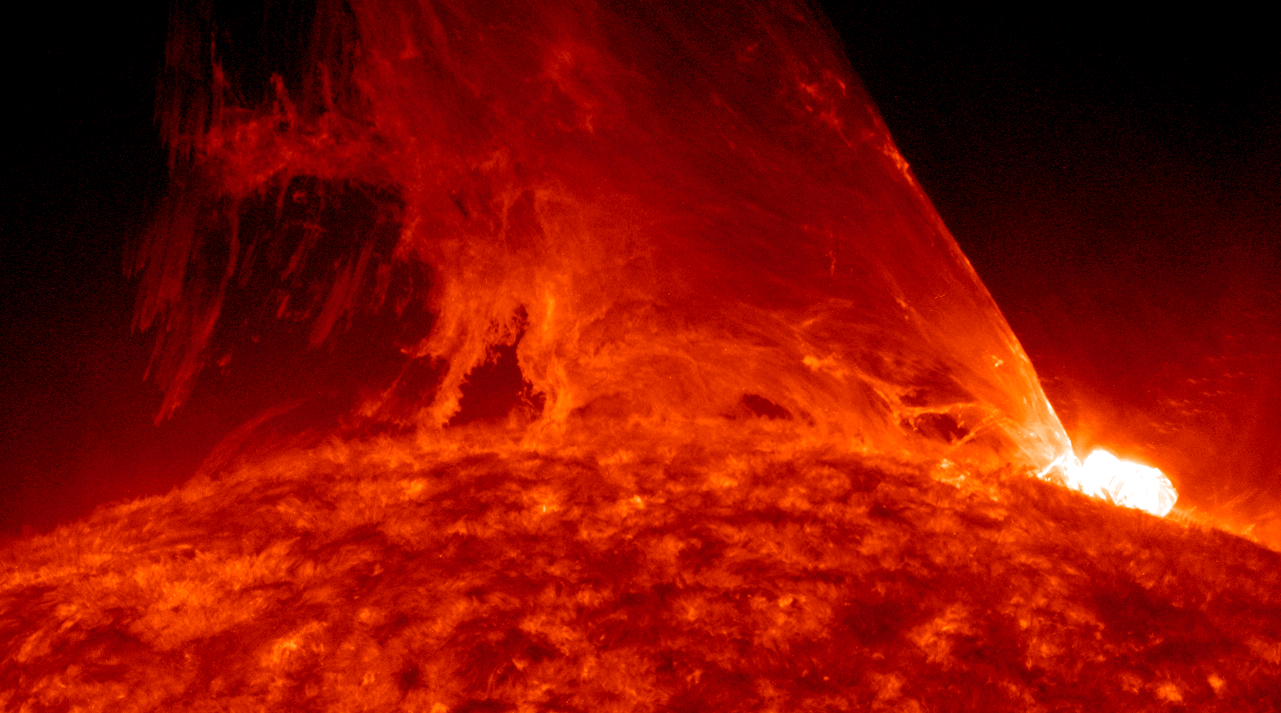
SDO captures images of the sun in 10 different wavelengths, each of which helps highlight a different temperature of solar material. Different temperatures can, in turn, show specific structures on the sun such as solar flares, which are giant explosions of light and x-rays, or coronal loops, which are streams of solar material traveling up and down looping magnetic field lines. The movie shows examples of both, as well as what's called prominence eruptions, when masses of solar material leap off the sun. The movie also shows a sunspot group on the solar surface. This sunspot, a magnetically strong and complex region appearing in mid-January 2014, was one of the largest in nine years.
Scientists study these images to better understand the complex electromagnetic system causing the constant movement on the sun, which can ultimately have an effect closer to Earth, too: Flares and another type of solar explosion called coronal mass ejections can sometimes disrupt technology in space. Moreover, studying our closest star is one way of learning about other stars in the galaxy. NASA's Goddard Space Flight Center in Greenbelt, Md. built, operates, and manages the SDO spacecraft for NASA's Science Mission Directorate in Washington, D.C.
SDO: Year One here.
SDO: Year 2 here.
SDO: Year 3 here.
Information about the individual clips used in this video is here.
Massive solar flares, graceful eruptions of solar material, and an enormous sunspot make up some of the imagery captured by NASA's Solar Dynamics Observatory during its fourth year in orbit.
Music: Stella Maris courtesy of Moby Gratis.
Watch this video on the NASA Goddard YouTube channel.
For complete transcript, click here.

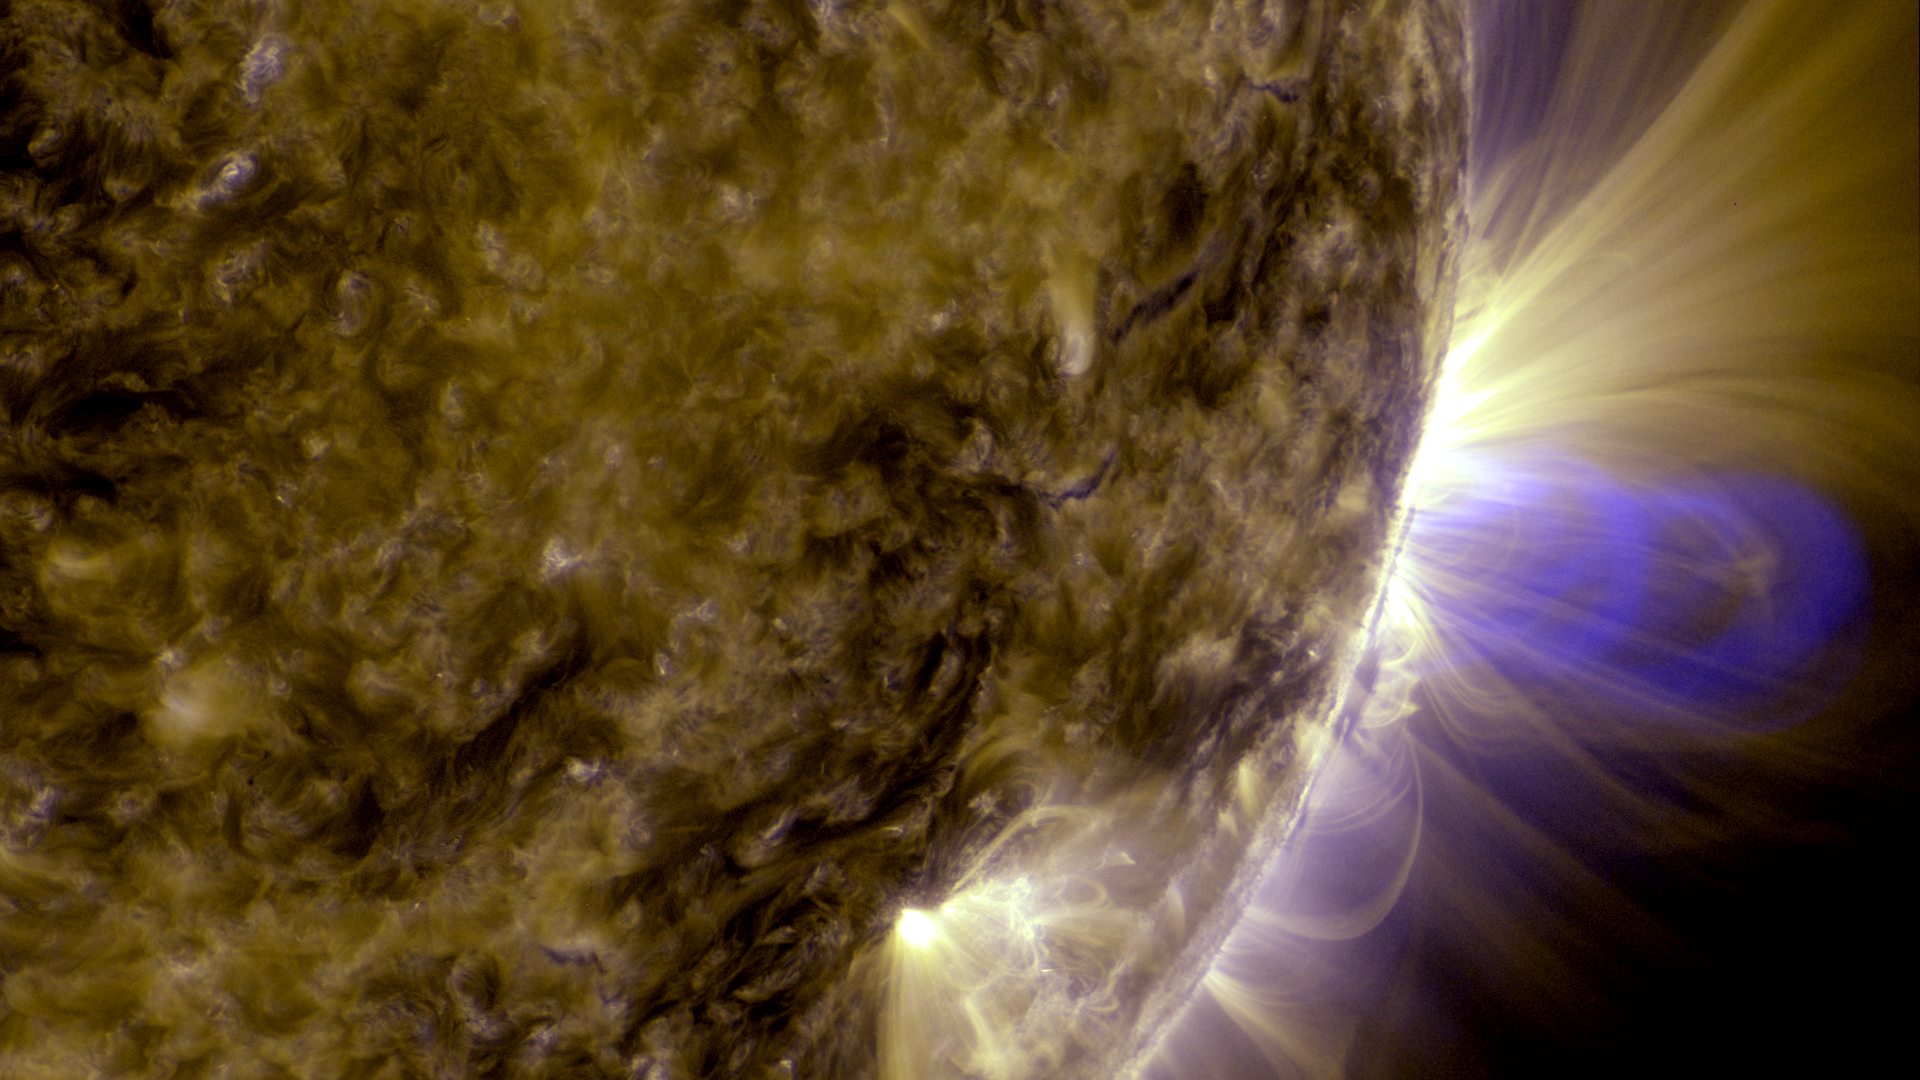
This image, and the one above, is a composite of 25 separate images spanning the period of February 11, 2013 to February 11, 2014. It uses the SDO AIA wavelength of 304 angstroms and reveals the zones on the sun where active regions, and associated eruptions, are most common during this part of the solar cycle. This version is widened to achieve a 16x9 aspect ratio.
Credit: NASA's Goddard Space Flight Center/SDO/S. Wiessinger
This image, and the one at the top, is a composite of 25 separate images spanning the period of February 11, 2013 to February 11, 2014. It uses the SDO AIA wavelength of 304 angstroms and reveals the zones on the sun where active regions, and associated eruptions, are most common during this part of the solar cycle. This version maintains the original aspect ratio of the AIA instrument imagery.
Credit: NASA's Goddard Space Flight Center/SDO/S. Wiessinger
For More Information
Credits
Please give credit for this item to:
NASA's Goddard Space Flight Center/SDO
-
Animators
- Tom Bridgman (Global Science and Technology, Inc.)
- Scott Wiessinger (USRA)
-
Video editor
- Scott Wiessinger (USRA)
-
Producer
- Scott Wiessinger (USRA)
-
Project support
- Genna Duberstein (USRA)
-
Writer
- Karen Fox (ADNET Systems, Inc.)
Release date
This page was originally published on Tuesday, February 11, 2014.
This page was last updated on Wednesday, May 3, 2023 at 1:51 PM EDT.
Missions
This visualization is related to the following missions:Series
This visualization can be found in the following series:Tapes
This visualization originally appeared on the following tapes:-
SDO: Year 4
(ID: 2014010)
Tuesday, February 11, 2014 at 5:00AM
Produced by - Robert Crippen (NASA)
Datasets used in this visualization
-
[SDO]
ID: 168This dataset can be found at: http://sdo.gsfc.nasa.gov/
See all pages that use this dataset -
SDO Continuum (Continuum) [SDO: HMI]
ID: 674 -
AIA 304 (304 Filter) [SDO: AIA]
ID: 677This dataset can be found at: http://jsoc.stanford.edu/
See all pages that use this dataset -
AIA 193 (193 Filter) [SDO: AIA]
ID: 679This dataset can be found at: http://jsoc.stanford.edu/
See all pages that use this dataset -
AIA 171 (171 Filter) [SDO: AIA]
ID: 680This dataset can be found at: http://jsoc.stanford.edu/
See all pages that use this dataset -
AIA 131 (131 Filter) [SDO: AIA]
ID: 730This dataset can be found at: http://jsoc.stanford.edu/
See all pages that use this dataset
Note: While we identify the data sets used in these visualizations, we do not store any further details, nor the data sets themselves on our site.
Related
- ID: 11742
 Produced Video
 - ID: 11745
 Produced Video
 - ID: 11203
 Produced Video
 - ID: 10966
 Produced Video
 - ID: 10748
 Produced Video