|
Exploring Earth from Space: Dr.
Darrel Williams, NASA/GSFC |
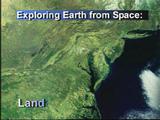 |
| Thank you Dr. Asrar, and good evening ladies and gentlemen. I would like to thank you for coming tonight to share in the excitement that we feel given the significant accomplishments within NASA's Earth Science Enterprise over the past 24 months. As our Space Science colleagues continue to look outward, exploring the universe, seeking signs of life, the images and animations that you will see tonight will reveal several unique perspectives of our own life-sustaining planet -- perspectives that we have acquired looking back at Earth from space. The vast majority of these compelling visuals were derived from recent Earth observation missions and related R&D activities funded by NASA's Earth Science enterprise. | 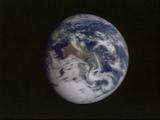 View Movie: [1.1 MB QuickTime] [5.6 MB MPEG-1] |
| I think that it is appropriate that we start off tonight by taking an "up close and personal" look at our own backyard. This spectacular image of the Mall area was acquired on Saturday, April 1st by Space Imaging's IKONOS sensor, which was launched about a year ago. Here we are moving across the Mall, from west to east and we will pause over the Capitol Building. Let's just sit back for a few seconds and enjoy the view. We will then gradually pull back from this highly localized view from space, to obtain a more regional perspective provided by Landsat 7, which was placed in orbit 18 months ago. This regional view permits us to follow the entire length of the Potomac River, from its headwaters in the Shenandoah's, 'til it flows into the Chesapeake Bay. We can also see the full extent of the Chesapeake and Delaware Bays as they flow into the Atlantic. We will continue to pull back farther to obtain more continental and global views of the Earth as provided by a new instrument known as MODIS, or the Moderate Resolution Imaging Spectroradiometer, the primary instrument on the Terra spacecraft launched just last December. Then, nearly daily global coverage acquired by the SeaWiFS instrument on OrbImage's OrbView2 satellite has been mosaicked to create a cloud-free time series to monitor the seasonal fluctuations in global productivity. | 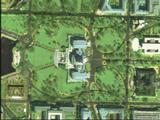 View Movie: [2.2 MB QuickTime] [11.4 MB MPEG-1] |
| Let's now look at the same data, but in the reverse sequence. While doing so, I believe that a good analogy which everyone can relate to is to consider the Earth as our patient, and we, as doctors, now have a variety of new tools to monitor our patients health. For example, the daily, global looks provided by MODIS and SeaWiFS are analogous to monitoring a patients pulse, respiration rate, and temperature. Landsat then provides a higher spatial resolution data set permitting us to conduct a "quarterly, seasonal checkup or physical" of our patient. The super high-resolution imagery provided by an IKONOS class instrument is equivalent to our microscope, permitting us to zoom in and do a biopsy of limited, specific areas. By manipulating this robust compliment of Earth observation data with today's powerful computers, we can now examine the linkages between global-scale Earth system processes and man's activities on the surface of the Earth. | 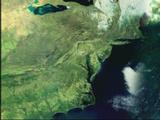 View Movie: [1.4 MB QuickTime] [6.2 MB MPEG-1] |
| Any doctor taking on a new patient likes to review records to develop a patients case history. Fortunately, we have been monitoring our patient's surface features since 1972, when we launched the first Landsat satellite. In essence, we have been creating a digital family photo album of the Earth's surface to monitor changes over time. This provides the primary database from which a variety of our patients' health issues can be addressed. As I've been speaking, we have started to cycle through a few examples of significant change as seen by tapping into the incredible archive of Landsat data. These examples include images showing massive deforestation of tropical forests near Santa Cruz, Bolivia, near the headwaters of the Amazon, we then show images acquired before and during the 1993 flood of the Missouri River. Finally, we take a look at change over a 27-year period around the nations fastest growing city, Las Vegas, Nevada. The rationale behind the creation of an image database of the Earth embodies the concept that imagery collected today are an irreplaceable investment in assessing the health of our planet now and in the future. Clearly, the value of this database increases with time. | 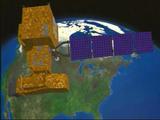 View Movie: [1.1 MB QuickTime] [5.7 MB MPEG-1] |
| In this next image sequence we start off with a MODIS view of the United States, then home in on the San Francisco Bay area, first using the new 250 meter bands of MODIS. We then zoom further into the Bay area with imagery acquired at the same time by another Terra sensor known as ASTER, which was contributed to the Terra mission by the Japanese. Data from the infrared bands have been used in this rendition, resulting in the bright red coloration. The ASTER instrument offers multiple high-resolution thermal bands for assessing land and water temperature, as illustrated here for the waters of the Sacramento River, the San Francisco Bay and the Pacific Ocean. | 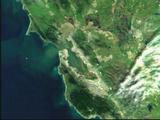 View Movie: [1.0 MB QuickTime] [5.3 MB MPEG-1] |
| Next, we illustrate the visual power of combining such data with topographic data of the Bay area. By draping the imagery over a computer generated model of the landscape we obtain a three dimensional perspective of the local terrain to help us better understand such things as storm run-off and land use patterns. Such terrain data have only been available for limited portions of the Earth's surface. However, a high-resolution topographic data set for ~ 80% of the Earth's land area was acquired recently during the Shuttle Radar Topography Mission, conceived and managed at the Jet Propulsion Laboratory. | 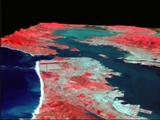 View Movie: [0.8 MB QuickTime] [3.7 MB MPEG-1] |
| We will now see an example of merged Landsat and shuttle radar topography data for an area in central New York State. We start off looking east, over the Mohawk Valley. The eastern shore of Lake Ontario appears in the lower left corner. Perhaps you can also pick out a couple of the Finger Lakes in the lower right hand corner of the screen? We will fly past Syracuse, then head north and east over the Adirondack Mountains. You might be wondering if the Adirondacks are really that rugged, and the answer is NO. This is the Adirondacks on steroids -- we have exaggerated the vertical dimension to accentuate the terrain relief in this area. We turn further east and south toward Albany, New York, then continue down the Hudson River Valley, past the Catskill Mountains on the right, and on toward New York City at the top of the screen. The merger of such digital terrain data with Earth observation data enhances our ability to more realistically visualize and assess our patient's land surface conditions. | 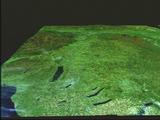 View Movie: [1.2 MB QuickTime] [5.8 MB MPEG-1] |
| The all-weather imaging capabilities afforded by radar were also used to acquire a high resolution data set of the continent of Antarctica in 1997 using a Canadian-built radar system. Radarsat Int'l acquired these data at the specific request of NASA. It was the first time that Antarctica was imaged in such detail. Since these data were acquired, some huge icebergs, one the size of the state of Rhode Island, have broken away from the continental shelf. Therefore, a special effort was made a few months ago to image Antarctica during the first year of Landsat 7 operations. | 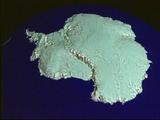 View Movie: [1.2 MB QuickTime] [6.1 MB MPEG-1] |
| From the barren lands of Antarctica we will transition to a time sequence of SeaWiFS data for the southern Atlantic region. This monthly time series of data permits us to monitor the seasonal and interannual fluctuations in oceanic productivity and vegetative growth on the continents. David Adamec will say more about monitoring ocean productivity later. Utilizing such data within a modeling framework, scientists have been able to predict the outbreak of devastating diseases, such as Rift Valley Fever in Africa, several months before the actual outbreak of the disease. This humanitarian application of satellite data permits authorities to order the medicines and supplies needed to lessen the impact of such disease outbreaks once they do occur. Of perhaps more local interest is the city of Baltimore, where a similar pathfinding application of remotely sensed data is currently being developed. We are trying to better understand the combination of environmental and geo-spatial factors associated with the occurrence of asthma attacks among Baltimore City school children. | 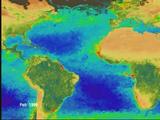 View Movie: [1.5 MB QuickTime] [7.6 MB MPEG-1] |
| This next video sequence relies on Landsat 7 data to illustrate the severity of the floods experienced in Mozambique this past March. The "before" image was acquired in August of 1999, and the "flooded" image was acquired on March 1st, 2000, near peak flood stage. A silhouette of the Washington, DC "diamond" has been digitized and superimposed on the flooded image to help the viewer better appreciate the scale of this natural disaster. Basically, a new water body roughly the size of the Delaware Bay was created in a matter of days. Authorities in the region were desperate to obtain timely imagery such as this, not only to assess the extent of the flood, but to assist them in deciding where to stage humanitarian relief efforts to best provide food and drinking water to the survivors. | 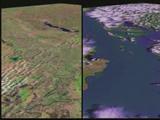 View Movie: [0.7 MB QuickTime] [3.3 MB MPEG-1] |
| In summary, there is no question that today's space technologies have altered, forever, our sense and understanding of our patient, the planet Earth. Over the last 1-3 years, the successful launches of the Landsat-7 and Terra missions, along with commercial systems such as the Space Imaging IKONOS venture, and industry/government partnerships like OrbImage's SeaWiFS mission, has resulted in the deployment of a new set of instruments that permit us to revisit nearly all regions of our planet daily, and seasonally, with better precision than ever before. The dynamic character of our planet, and the intimate relationship between its environmental systems and we who live here are now better appreciated and understood than ever before. Does that mean we know it all? The answer is a resounding NO! -- we still have a lot to learn. For example, in addition to improved monitoring of our patients' surface conditions, we also have equal interest in monitoring and modeling the dynamics of the Earth's atmosphere and oceans. You will hear more about these topics from the next two speakers. I will now turn the podium over to Dr. Marshall Shepherd, who will help us better understand why certain weather events, such as the severe flooding in Mozambique, may have occurred in the first place. I thank you for your attention and I hope you enjoyed the ride. |  View Movie: [2.0 MB QuickTime] [10.1 MB MPEG-1] |