September 16, 2003 - (date of web publication)
Hurricane Isabel - Latest Images
NASA is keeping a close watch on Hurricane Isabel as it churns in the Atlantic with winds that top 150 miles per hour. Instruments aboard NASA's suite of Earth-observing satellites are monitoring the storm as it makes its way toward the East Coast of the United States. Scientists use these space-based tools to look inside Hurricane Isabel and access the storms impact on the United States East Coast.
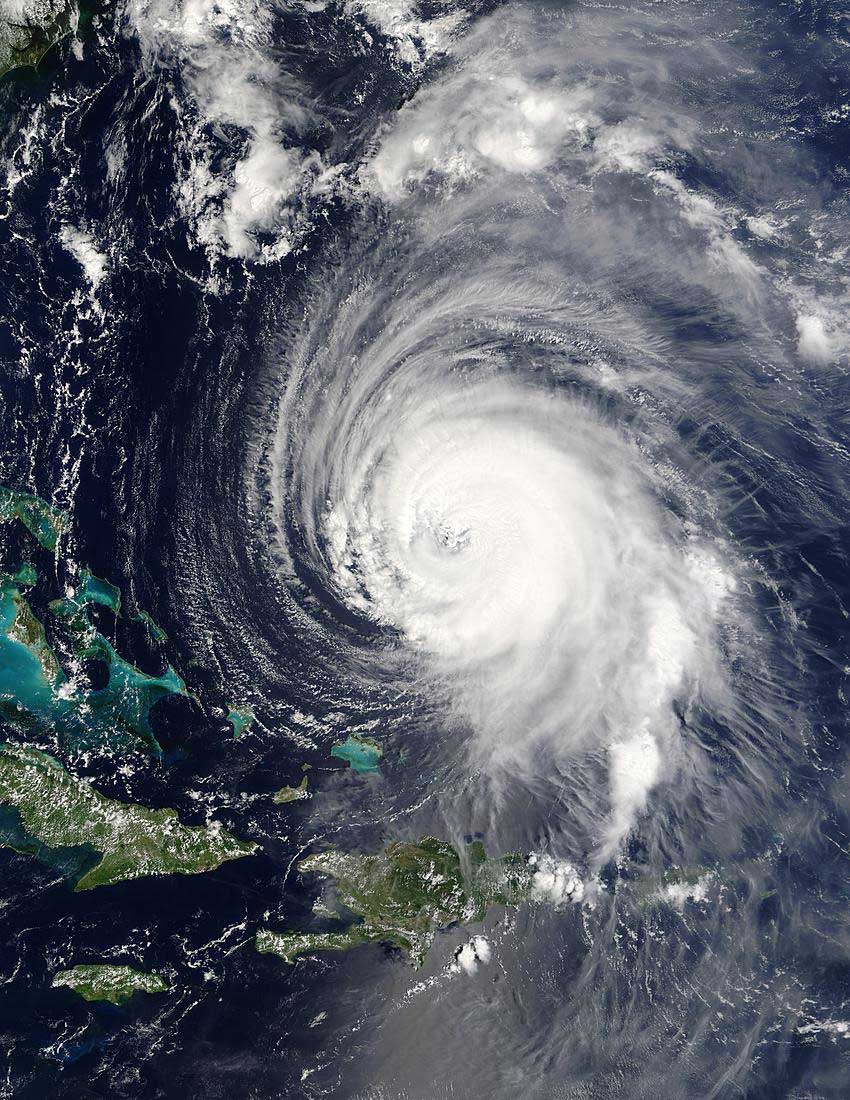
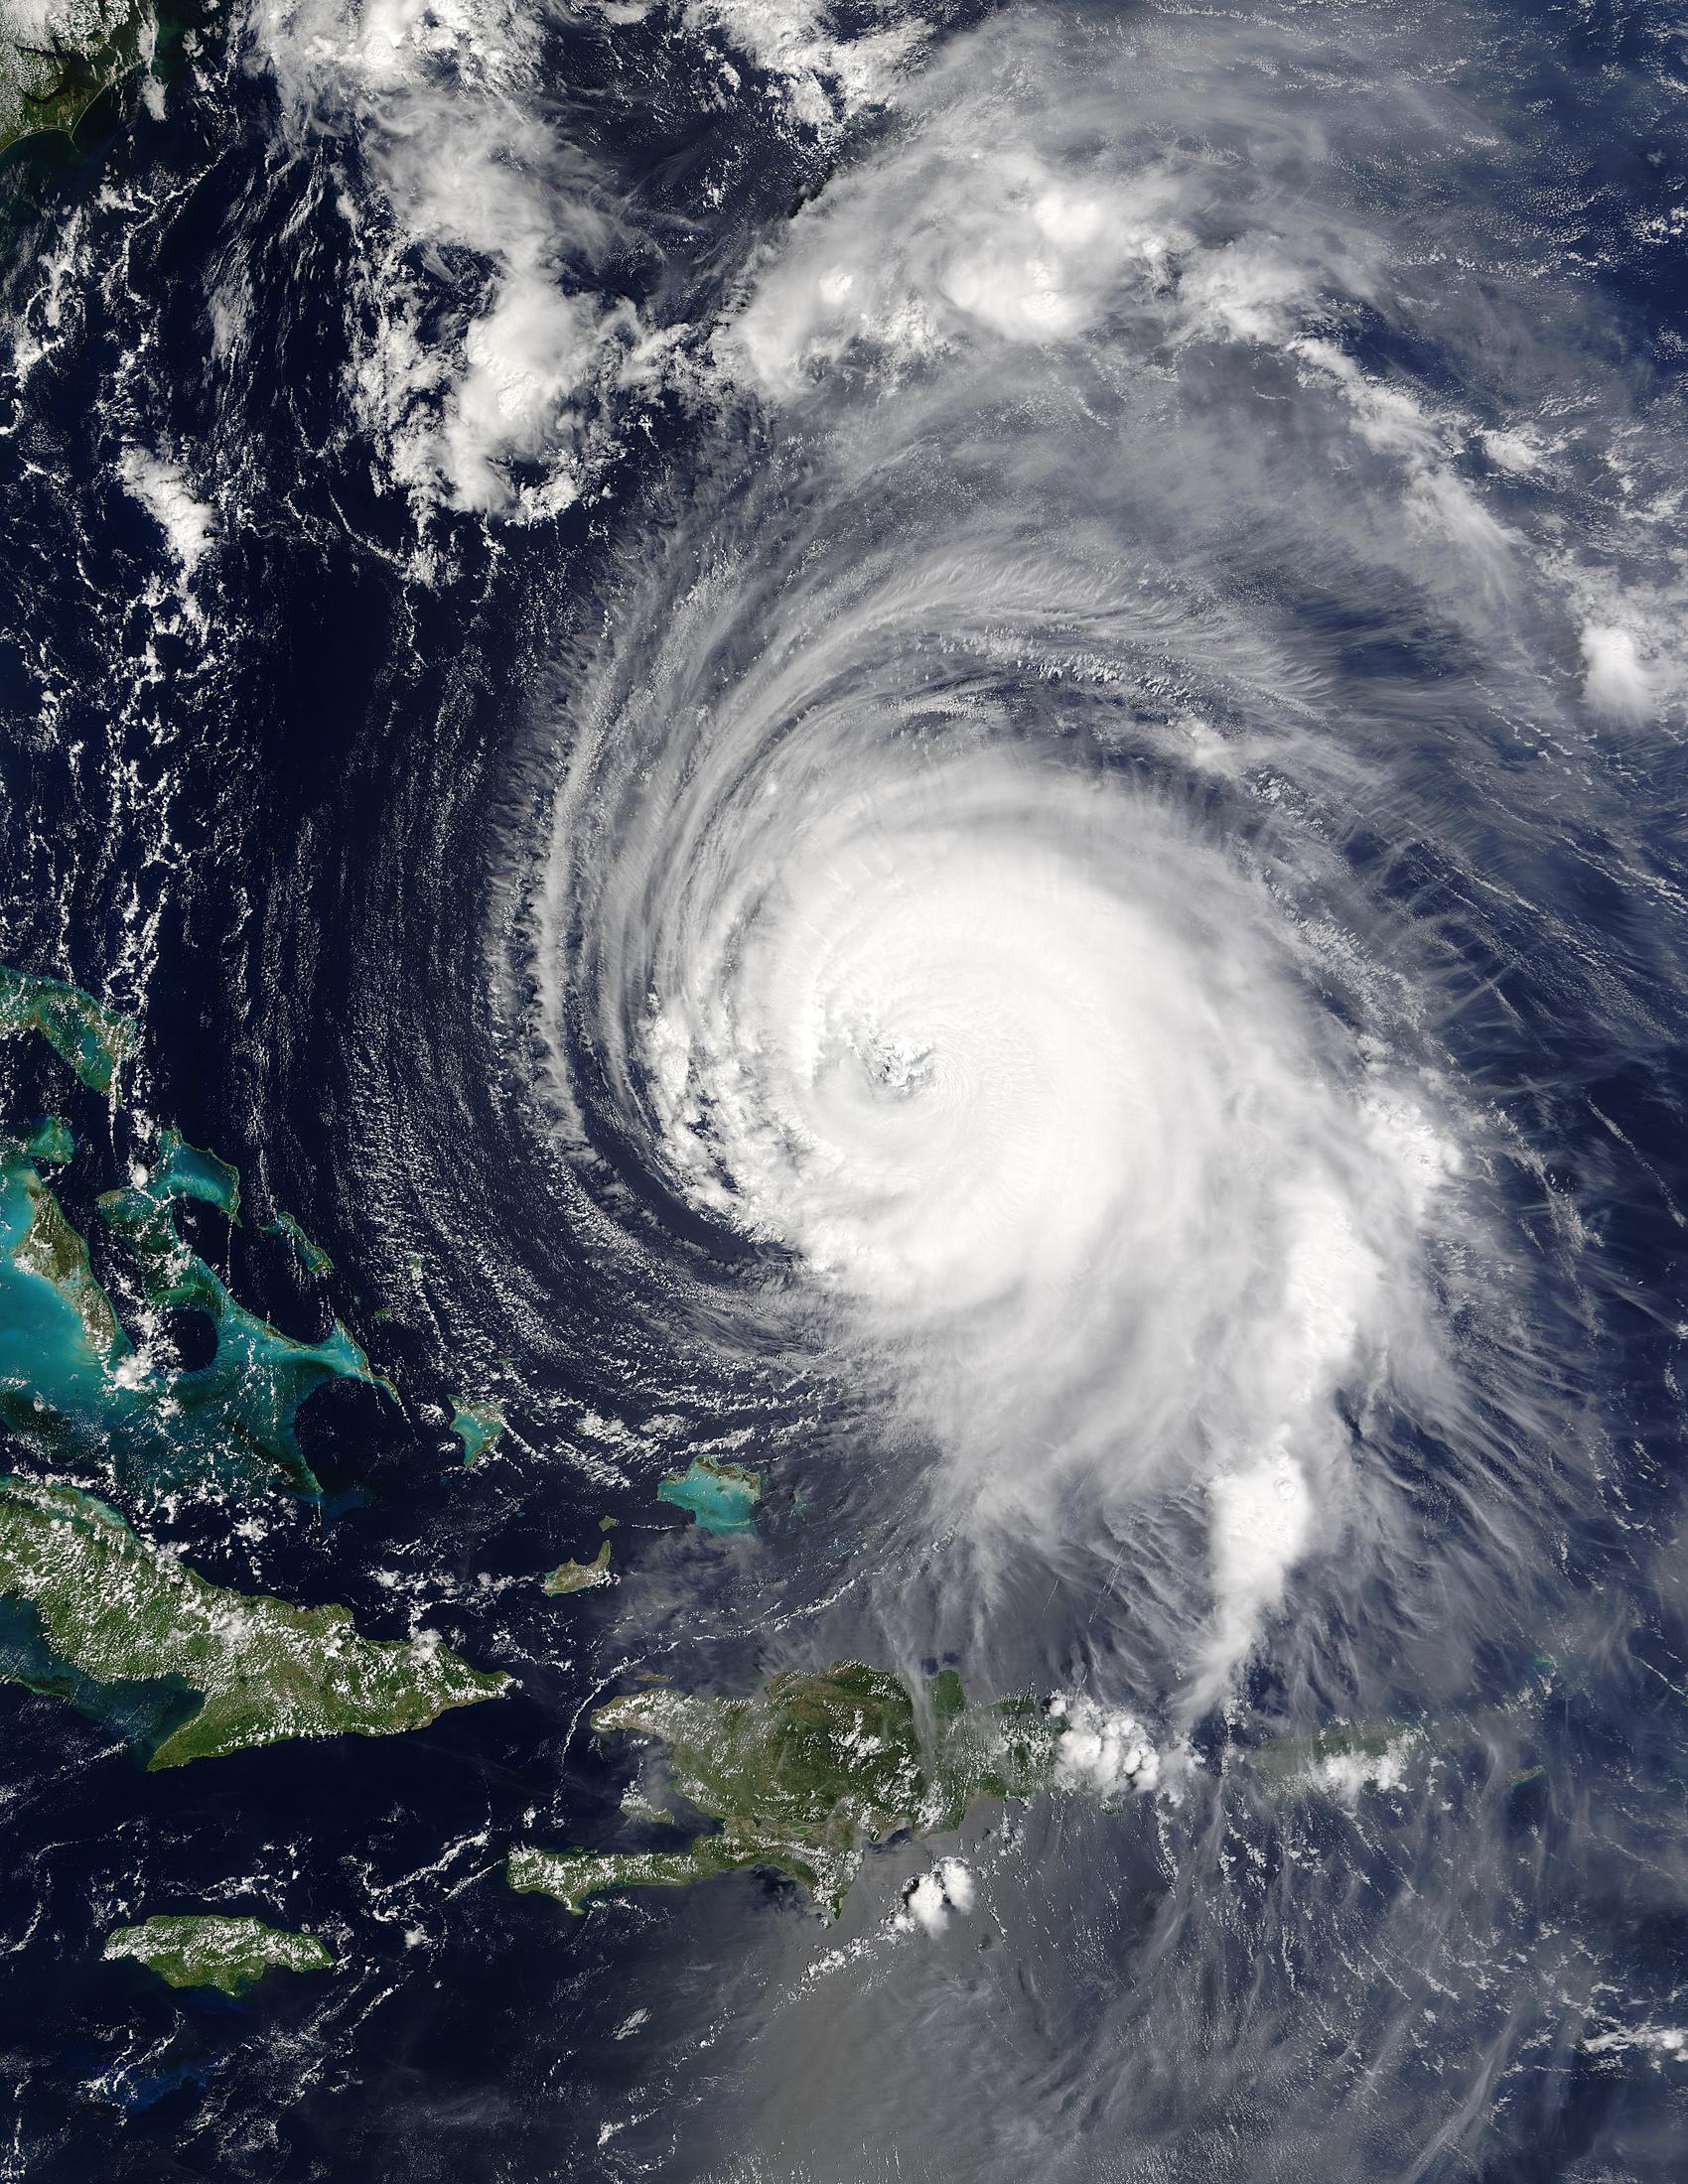
The Moderate Resolution Imaging Spectroradiometer (MODIS) on NASA’s Terra satellite captured this image of Hurricane Isabel just east of the Bahamas on September 15, 2003 at 15:30 UTC. Though the storm had begun to weaken, it still packed winds of 138 miles per hour with gusts up to 167 miles per hour.
Click here for high resolution image
Image courtesy: MODIS Land Rapid Response Team at NASA GSFC.
Hurricanes act as heat engines, drawing energy up from warm tropical ocean waters to power the intense winds, powerful thunderstorms, and immense ocean surges. These tools help weather experts determine if a tropical cyclone is likely to strengthen or weaken and how much rain will fall on land.
September 15, 2003 view of Isabel
September 12, 2003 view of Isabel
September 11, 2003 view of Isabel
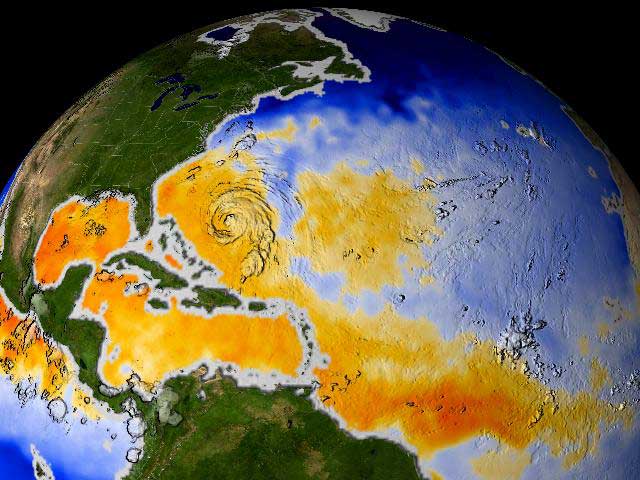
WARM WATER FUELS HURRICANE ISABEL
Click here for high resolution (7.2 MB)
Click here for animation (3 MB)
Click here for a different version of this animation that shows through September 23, when Isabel hit the coast of the United States. (3 MB)
Image courtesy: NASA/NASDA
Warm water fuels hurricanes. Hurricanes drive on 82 'F or warmer sea surface temperatures. NASA satellites can detect sea surface temperatures through clouds and helps determine if a tropical cyclone is likely to strengthen or weaken. In this visualization, Hurricane Fabian runs through a large patch of warm water, orange and red indicate 82 F and warmer, and leaves a blue cold trail behind. Cold trails can sometimes weaken tropical storms. However, Hurricane Isabel took a different path fueling up on warm water next to Fabian's cold trail, and leaving another cold trail behind. Aqua satellite's Advanced Microwave Scanning Radiometer (AMSR-E) provided sea surface temperatures for this animation. Data runs from August 22 to September 15, 2003. AMSR-E was developed by NASA and the National Space Development Agency (NASDA) of Japan.
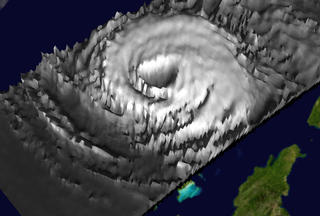
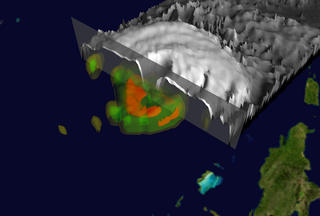
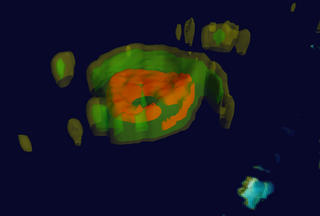
CHECKING UNDER ISABEL'S HOOD
|
|
|
Click here for animation (2.39 MB)
Click for high resolution of left image (16 MB)
Click for high resolution of middle image (16 MB)
Click for high resolution of right image (16 MB)
Images courtesy: NASA/NASDA
The eye of a hurricane may be the calm of the storm, but it also houses the engine that drives the storm. NASA and National Space Development Agency (NASDA) of Japan Tropical Rainfall Measuring Mission (TRMM) satellite looked under Isabel's hood and showed scientists the pistons that power the hurricane, giving them an idea of the intensity and distribution of rainfall. The world's first and only spaceborne rain radar allows scientists to create 3-D views of precipitation, height of the rain column and warmth of the core inside powerful hurricanes. Red color indicates rain rates in excess of 2 inches per hour. Green represents rain rates in excess of 1.0 inch per hour. Yellow shows excess of .5 inches of rain per hour. TRMM captured this image September 15, 2003.
For more information contact:
Rani D. Chohan
Goddard Space Flight Center
Greenbelt, MD 20771
Phone: 301-286-2483