|
|
Goddard TV Video Tape: G2003-046
|
Movie
|
Title
|
|
Great Zoom out of Chicago, IL: The Adler Planetarium
|

|
Great Zoom into Chicago, IL: The Adler Planetarium
|

|
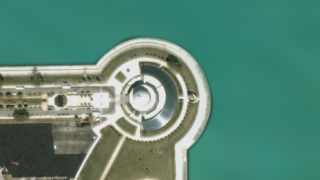
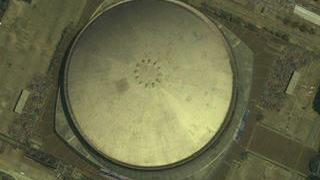
Great Zoom into Houston, Texas: Reliant Stadium
|
|
Great Zoom out of Houston, Texas: Reliant Stadium
|

|
Great Zoom into Houston, Texas: Reliant Stadium (with spin)
|
|
Great Zoom out of Houston, Texas: Reliant Stadium (with spin)
|
|
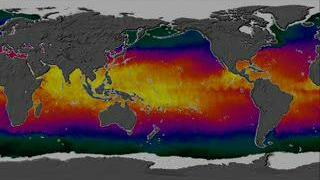
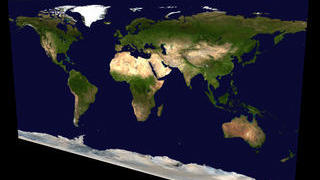
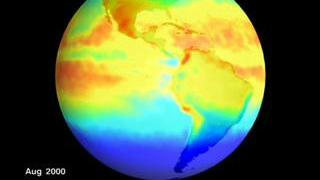
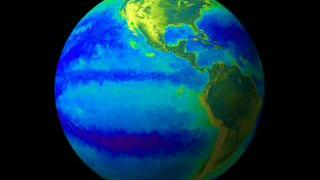
AMSR-E SST Global Flat Map: Sea Surface Temperature Data Used to Forecast 2003 Hurricane Season
|
|
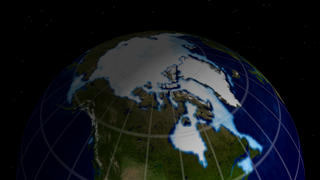
Polar Sea Ice in the 1990s
|
|
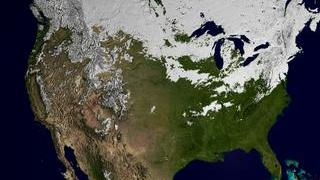
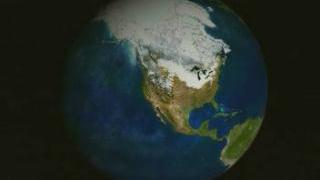
Snow Cover over the USA during the Winter of 2002/2003
|
|
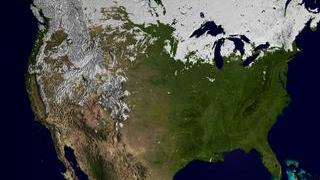
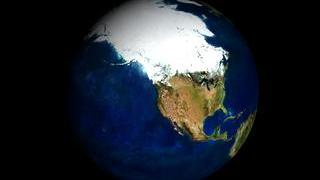
Snow Cover over the USA during the Winter of 2001/2002
|
|
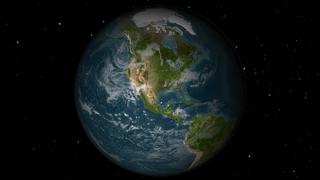
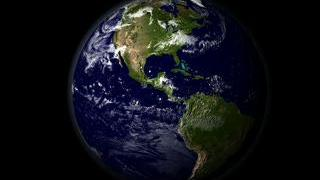
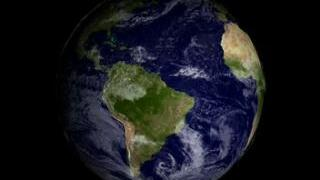
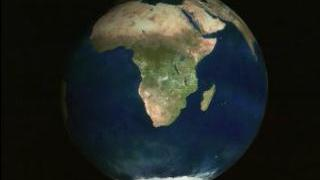
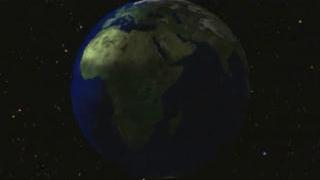
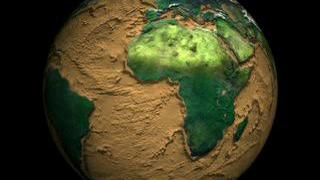
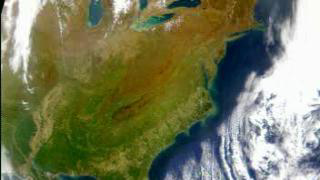
Rotating Blue Marble Globe with Clouds
|
|
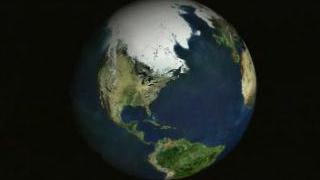
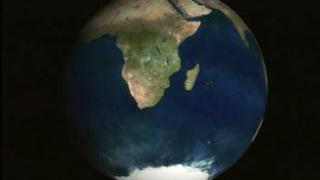
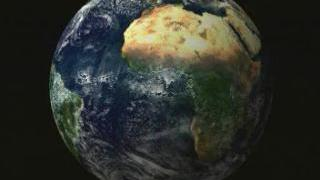
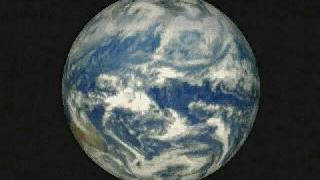
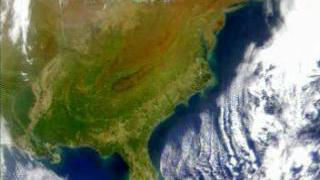
Rotating Blue Marble Globe
|
|
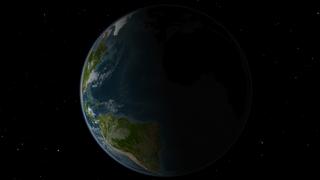
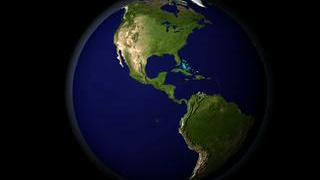
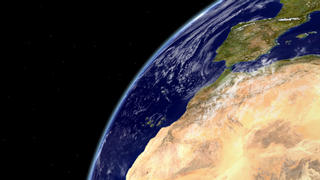
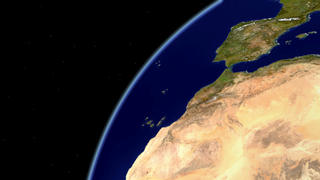
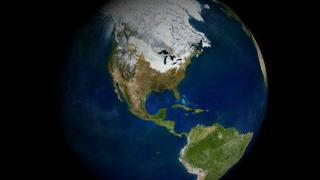
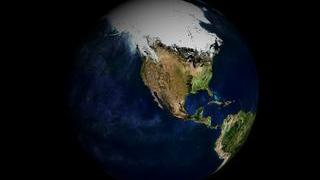
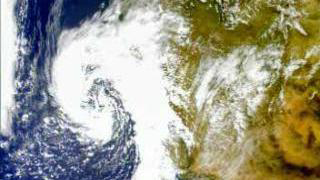
Looking at our World from Space
|
|
Looking Down at the Earth from Space
|

|
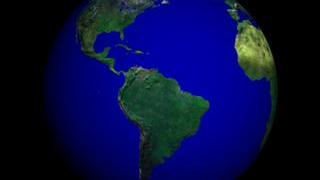
Great Zoom out of the Amazon, Brazil
|
|
Great Zoom into the Amazon, Brazil
|
|
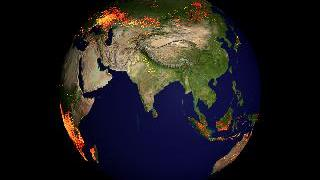
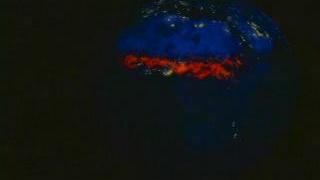
Global Revolution of Fires During 2001 and 2002
|
|
MODIS Albedo Globe Unwraps to MODIS Albedo True Color Flat Map
|
|
Great Zoom into New York, NY: Central Park
|
|
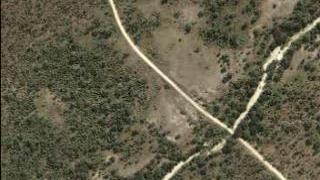
Great Zoom into Sabie River, Africa (EOS Land Validation Site)
|
|
Great Zoom out of Sabie River, Africa (EOS Land Validation Site)
|
|
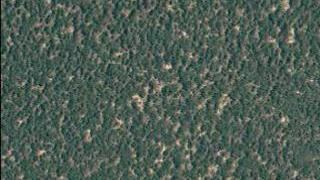
Great Zoom into Mongu, Africa (EOS Land Validation Site)
|
|
Great Zoom out of Mongu, Africa (EOS Land Validation Site)
|
|
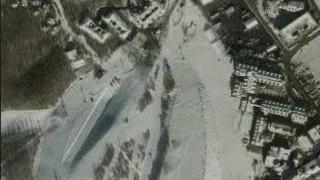
Great Zoom out of Park City, UT
|
|
Great Zoom into Park City, UT
|
|
Great Zoom out of New Orleans, LA: The Louisiana Superdome
|
|
Great Zoom into New Orleans, LA: The Louisiana Superdome
|

|
Grasslands of the World
|
|
Great Zoom into Seattle, WA: The Space Needle
|
|
Great Zoom into Tucson, AZ: The University of Arizona Football Stadium
|
|
Erythemal Index for August 2000 through July 2001: Slow Rotating Globe (With Dates)
|
|
Spinning Pathfinder Earth with Zoom into Alaska
|
|
Terra/MOPITT CO 3D Globe
|
|
Great Zoom out of Atlanta, GA: The State Capitol Building
|
|
Great Zoom into Boston, MA: The Bunker Hill Monument
|
|
Great Zoom into San Francisco, CA: Fisherman's Wharf
|
|
Great Zoom into Chicago, IL: The Sears Tower
|
|
Great Zoom into Atlanta, GA: The State Capitol Building
|
|
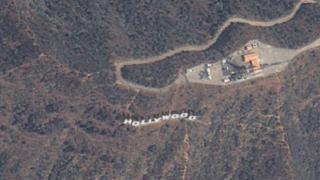
Great Zoom into Los Angeles, CA: The Hollywood Sign
|
|
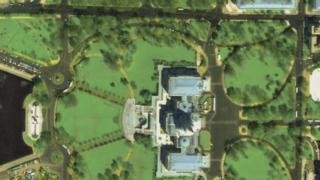
Great Zoom into Washington, DC: the U.S. Capitol
|
|
SeaWiFS: El Niño on a Globe (2nd version)
|
|
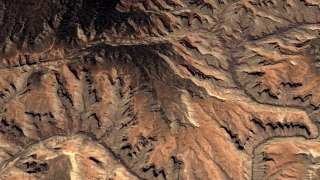
Grand Canyon, Natural Color
|
|
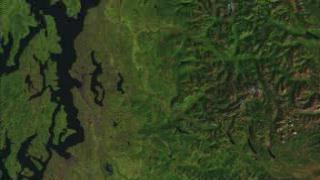
Seattle
|
|
HoloGlobe: Topography and Bathymetry on a Globe
|
|
HoloGlobe: Draining the Pacific Ocean
|
|
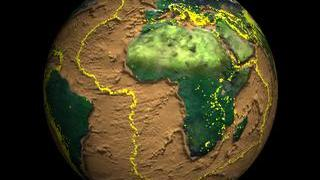
HoloGlobe: Cumulative Earthquake Activity from 1960 through 1995 on a Globe
|
|
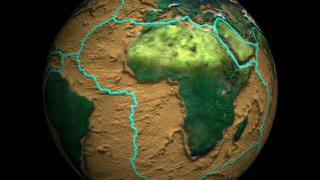
HoloGlobe: Tectonic Plate Boundaries on a Globe
|
|
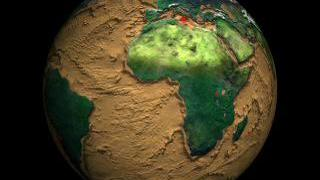
HoloGlobe: Active Volcanoes from 1960 through 1995 on a Globe
|
|
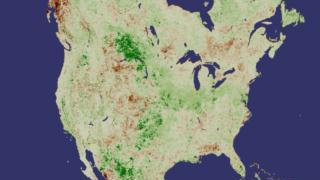
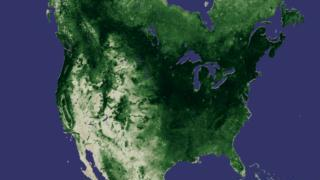
North America NDVI 2000 July Anomaly
|
|
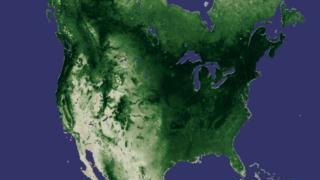
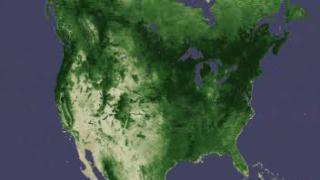
North America NDVI 2000 July
|
|
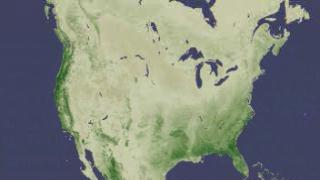
North America NDVI Average July
|
|
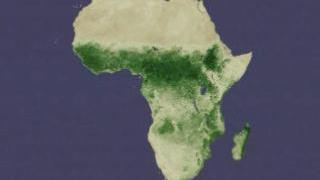
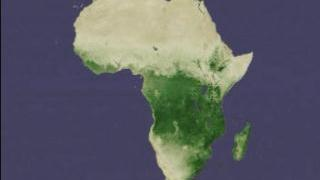
Monthly NDVI for Africa: July 1981-July 2000
|
|
Seasonal NDVI for Africa: 1981-2000 Averaged Without Month Notation
|
|
Monthly NDVI for North America: July 1981-July 2000
|
|
Seasonal NDVI for North America: 1981-2000 Averaged, Without Month Notation
|
|
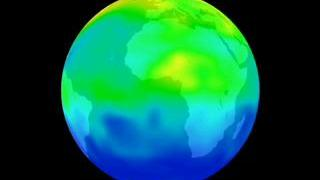
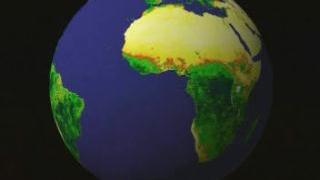
Global Vegetation Index
|
|
Global Surface Reflectance (MODIS)
|
|
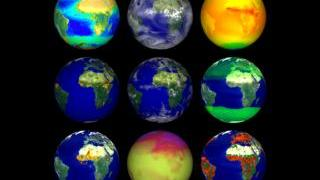
Terra 9-Globe Dataset
|
|
Nine Datasets on a Single Globe with Wipe Between Different Datasets
|
|
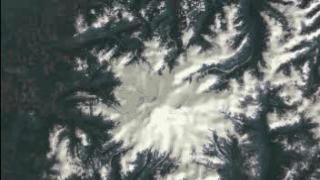
Mt. St. Helens Flyby
|
|
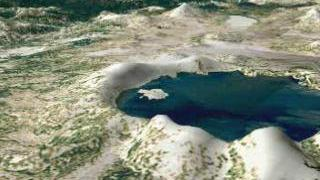
Crater Lake Flyby
|
|
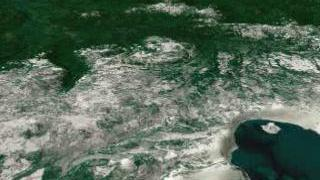
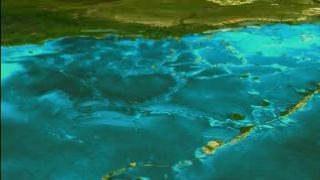
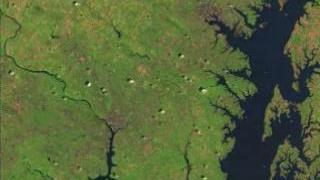
Florida Everglades Flyby
|
|
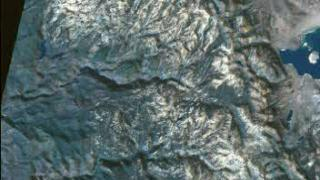
Pacific Northwest Flyby
|
|
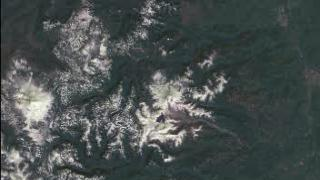
Yosemite National Park - A Bird's Eye View
|
|
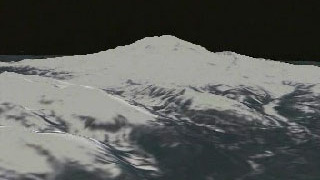
Mt. Rainier Flyby Without Sky
|
|
Mt. Rainier Flyby with Sky
|
|
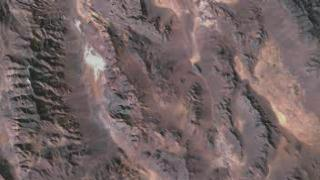
Death Valley Flyby
|
|
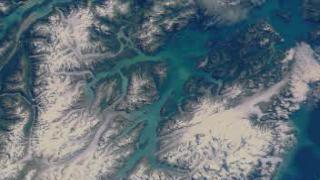
Glacier Bay Flyby
|
|
Washington D.C. and Baltimore With Terrain, x 3 Exaggeration
|
|
Dallas and Fort Worth Flyby
|
|
New York City Flyby
|
|
San Francisco Flyby: Channels 543
|
|
Los Angeles Flyby
|
|
Dallas Flyby
|
|
Chicago Flyby
|
|
Boston Flyby
|
|
Flight along the Washington-Baltimore Corridor
|
|
Earth at Night
|
|
Seattle Flyover: May 28, 1998
|
|
Buffalo Flyover: April 12, 1998
|
|
Detroit Flyover: April 12, 1998
|
|
Chicago Flyover: April 12, 1998
|
|
New Orleans Flyover: March 2, 1998
|
|
Tampa/St. Petersburg Flyover: April 12, 1998
|
|
Miami Flyover: May 2, 1998
|
|
Cape Hatteras Flyover: April 12, 1998
|
|
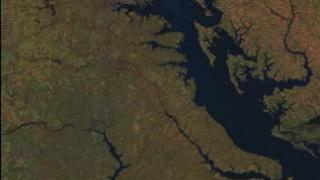
Chesapeake Bay Flyover: April 12, 1998
|
|
Boston Flyover: October 6, 1997
|
|
Flat Globe: Showing the Changing Seasons
|