Next Tape
Goddard TV Video Tape: G2003-036
Movie
Title
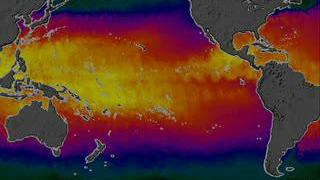
AMSR-E Anomalous Pacific Sea Surface Temperature Data Used to predict 2003 Hurricane Season
AMSR-E Anomalous Pacific Sea Surface Temperature Data Used to predict 2003 Hurricane Season
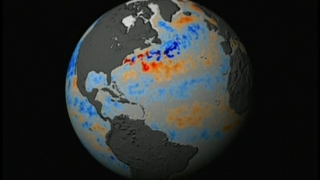
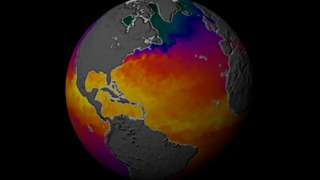
AMSR-E Anomalous Atlantic Sea Surface Temperature Data Used to Forecast 2003 Hurricane Season
AMSR-E Anomalous Atlantic Sea Surface Temperature Data Used to Forecast 2003 Hurricane Season
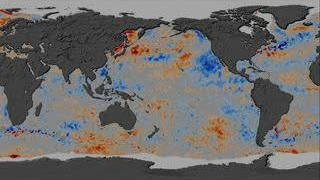
AMSR-E Global Anomalous Sea Surface Temperature Data Used to Forecast 2003 Hurricane Season
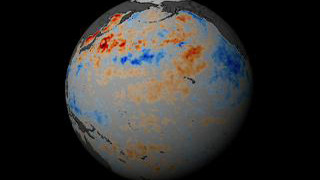
AMSR-E Pacific Sea Surface Temperature Data Used to Forecast 2003 Hurricane Season
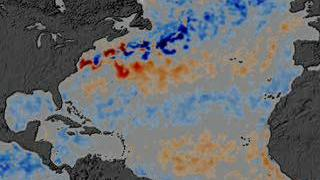
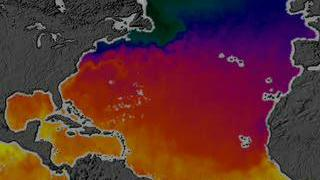
AMSR-E Atlantic Sea Surface Temperature Data Used to Forecast 2003 Hurricane Season
AMSR_E Pacific Sea Surface Temperature Data Used to Forecast 2003 Hurricane Season
AMSR-E Sea Surface Temperature in the Atlantic Used to Forecast 2003 Hurricane Season
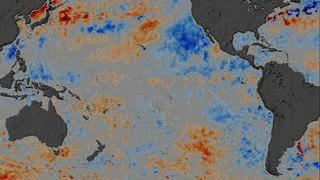
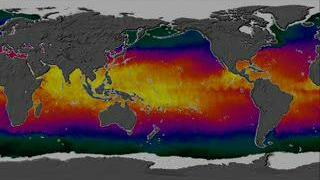
AMSR-E SST Global Flat Map: Sea Surface Temperature Data Used to Forecast 2003 Hurricane Season
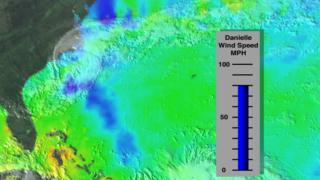
Sea Surface Temp and Hurricane Connections: TRMM and GOES, Aug. 22, 1998 - Sept. 3, 1998 (Deluxe)
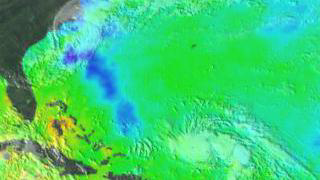
Sea Surface Temp and Hurricane Connections: TRMM and GOES, Aug. 22, 1998 - Sept. 3, 1998 (Basic)